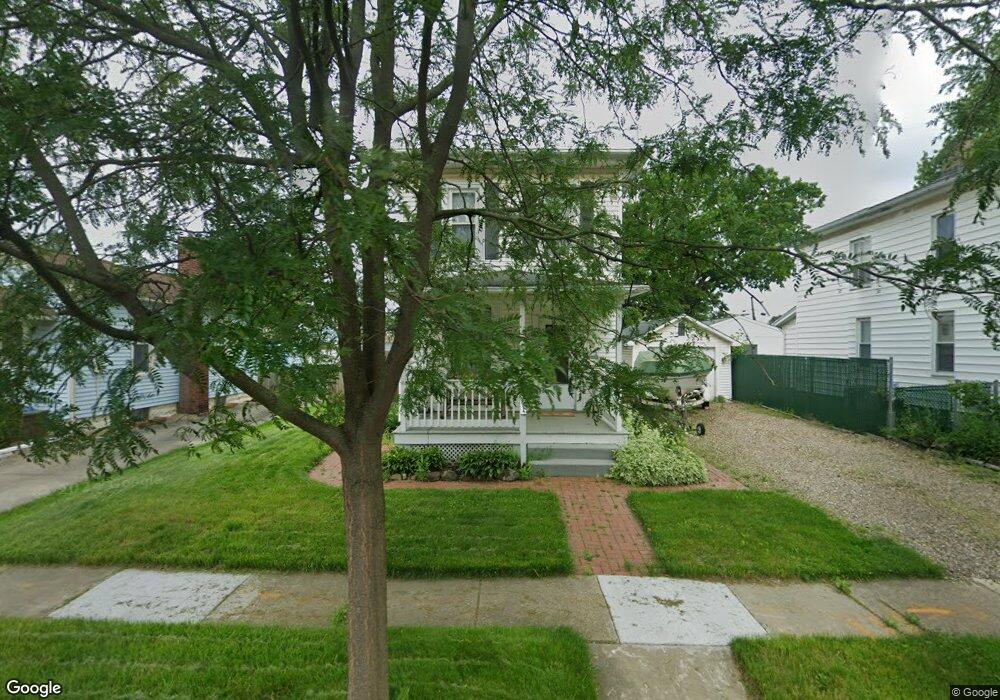
715 7th St SW Massillon, OH 44647
West Park-Columbia NeighborhoodEstimated Value: $101,000 - $126,000
2
Beds
1
Bath
1,232
Sq Ft
$90/Sq Ft
Est. Value
About This Home
This home is located at 715 7th St SW, Massillon, OH 44647 and is currently estimated at $110,472, approximately $89 per square foot. 715 7th St SW is a home located in Stark County with nearby schools including Massillon Intermediate School, Massillon Junior High School, and Washington High School.
Ownership History
Date
Name
Owned For
Owner Type
Purchase Details
Closed on
Dec 16, 2005
Sold by
Thomas Kelly L and Thomas Kenneth
Bought by
Stuber Alton Edward
Current Estimated Value
Home Financials for this Owner
Home Financials are based on the most recent Mortgage that was taken out on this home.
Original Mortgage
$63,011
Outstanding Balance
$35,402
Interest Rate
6.36%
Mortgage Type
FHA
Estimated Equity
$75,070
Purchase Details
Closed on
Dec 20, 1996
Sold by
Neil Fred W
Bought by
Sorrell Kelly L
Home Financials for this Owner
Home Financials are based on the most recent Mortgage that was taken out on this home.
Original Mortgage
$55,794
Interest Rate
7.74%
Mortgage Type
FHA
Purchase Details
Closed on
Oct 31, 1994
Sold by
Snider Marie L
Bought by
Neil Fred W and Neil Amy
Home Financials for this Owner
Home Financials are based on the most recent Mortgage that was taken out on this home.
Original Mortgage
$29,450
Interest Rate
8.68%
Mortgage Type
New Conventional
Create a Home Valuation Report for This Property
The Home Valuation Report is an in-depth analysis detailing your home's value as well as a comparison with similar homes in the area
Home Values in the Area
Average Home Value in this Area
Purchase History
| Date | Buyer | Sale Price | Title Company |
|---|---|---|---|
| Stuber Alton Edward | $64,000 | -- | |
| Sorrell Kelly L | $56,000 | -- | |
| Neil Fred W | $31,000 | -- |
Source: Public Records
Mortgage History
| Date | Status | Borrower | Loan Amount |
|---|---|---|---|
| Open | Stuber Alton Edward | $63,011 | |
| Previous Owner | Sorrell Kelly L | $55,794 | |
| Previous Owner | Neil Fred W | $29,450 |
Source: Public Records
Tax History Compared to Growth
Tax History
| Year | Tax Paid | Tax Assessment Tax Assessment Total Assessment is a certain percentage of the fair market value that is determined by local assessors to be the total taxable value of land and additions on the property. | Land | Improvement |
|---|---|---|---|---|
| 2025 | -- | $29,020 | $9,210 | $19,810 |
| 2024 | -- | $29,020 | $9,210 | $19,810 |
| 2023 | $1,100 | $21,490 | $7,700 | $13,790 |
| 2022 | $552 | $21,490 | $7,700 | $13,790 |
| 2021 | $1,121 | $21,490 | $7,700 | $13,790 |
| 2020 | $935 | $16,840 | $6,300 | $10,540 |
| 2019 | $921 | $16,840 | $6,300 | $10,540 |
| 2018 | $916 | $16,840 | $6,300 | $10,540 |
| 2017 | $834 | $14,320 | $4,970 | $9,350 |
| 2016 | $848 | $14,320 | $4,970 | $9,350 |
| 2015 | $838 | $14,320 | $4,970 | $9,350 |
| 2014 | $839 | $13,870 | $4,800 | $9,070 |
| 2013 | $419 | $13,730 | $4,800 | $8,930 |
Source: Public Records
Map
Nearby Homes
- 512 6th St SW
- 532 4th St SW
- 324 Snyder Place SW
- 726 Neale Ave SW
- 429 11th St SW
- 425 11th St SW
- 505 Neale Ave SW
- 1117 Cleveland St SW
- 1105 Tremont Ave SW
- 24 Houston St SW
- 315 14th St SW
- 804 Erie St S
- 17 Maple Ave SE
- 202 Rose Ave SE
- 1301 Lincoln Way NW
- 104 16th St SW
- 1225 Erie St S
- 3476 Joyce Ave NW Unit 15
- 3414 Joyce Ave NW Unit 18
- Lot 42 Joyce Ave NW
- 721 7th St SW
- 712 7th St SW
- 725 7th St SW
- 705 7th St SW
- 715 Walnut Rd SW
- 731 7th St SW
- 714 8th St SW
- 721 Walnut Rd SW
- 716 Spruce Ave SW
- 720 8th St SW
- 716 7th St SW
- 710 8th St SW
- 720 7th St SW
- 625 Walnut Rd SW
- 730 8th St SW
- 704 8th St SW
- 724 7th St SW
- 638 Walnut Rd SW
- 632 Walnut Rd SW
- 621 Walnut Rd SW