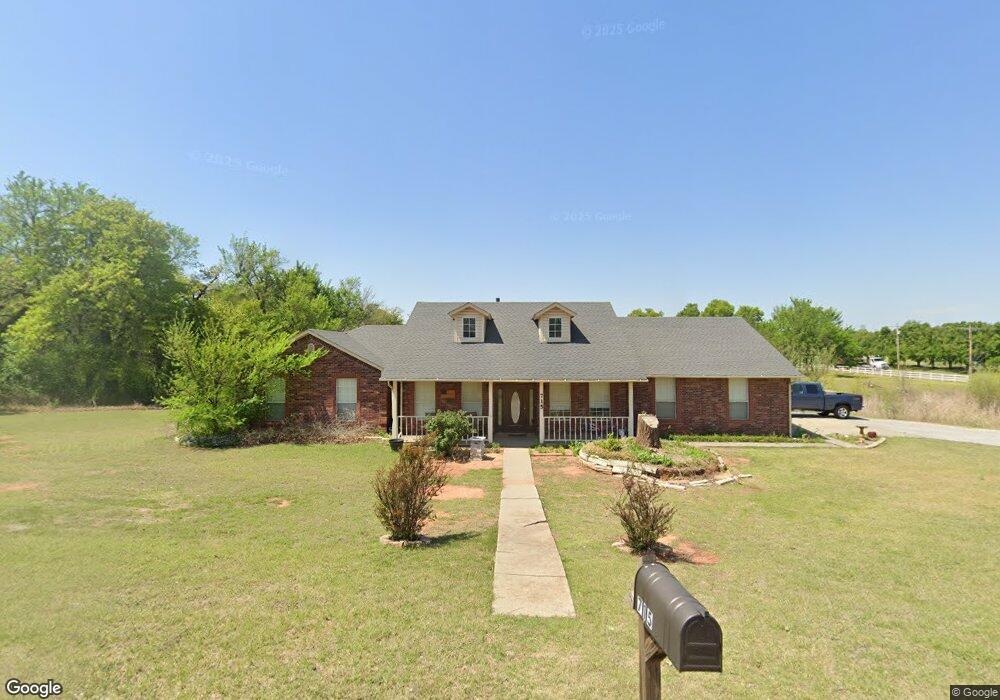
715 Autumn Way Blanchard, OK 73010
West Blanchard NeighborhoodEstimated Value: $265,498 - $306,000
3
Beds
2
Baths
1,652
Sq Ft
$175/Sq Ft
Est. Value
About This Home
This home is located at 715 Autumn Way, Blanchard, OK 73010 and is currently estimated at $288,625, approximately $174 per square foot. 715 Autumn Way is a home located in Grady County with nearby schools including Blanchard Elementary School, Blanchard Intermediate School, and Blanchard Middle School.
Ownership History
Date
Name
Owned For
Owner Type
Purchase Details
Closed on
Dec 30, 2011
Sold by
Brookman Tara A and Brookman Brandon Keith
Bought by
Berry Rogr J
Current Estimated Value
Home Financials for this Owner
Home Financials are based on the most recent Mortgage that was taken out on this home.
Original Mortgage
$90,900
Outstanding Balance
$62,271
Interest Rate
4.04%
Mortgage Type
New Conventional
Estimated Equity
$226,354
Purchase Details
Closed on
Feb 7, 2007
Sold by
Miller Tammy Ranee and Walker Tammy R
Bought by
Brookman Tara A and Brookman Brandon Keith
Home Financials for this Owner
Home Financials are based on the most recent Mortgage that was taken out on this home.
Original Mortgage
$151,800
Interest Rate
6.17%
Mortgage Type
FHA
Purchase Details
Closed on
Feb 2, 2007
Sold by
Walker Warren T and Walker Warren Todd
Bought by
Miller Tammy Ranee
Home Financials for this Owner
Home Financials are based on the most recent Mortgage that was taken out on this home.
Original Mortgage
$151,800
Interest Rate
6.17%
Mortgage Type
FHA
Create a Home Valuation Report for This Property
The Home Valuation Report is an in-depth analysis detailing your home's value as well as a comparison with similar homes in the area
Home Values in the Area
Average Home Value in this Area
Purchase History
| Date | Buyer | Sale Price | Title Company |
|---|---|---|---|
| Berry Rogr J | $151,500 | Tri-City Closing & Escrow | |
| Brookman Tara A | $153,000 | None Available | |
| Miller Tammy Ranee | -- | None Available |
Source: Public Records
Mortgage History
| Date | Status | Borrower | Loan Amount |
|---|---|---|---|
| Open | Berry Rogr J | $90,900 | |
| Previous Owner | Brookman Tara A | $151,800 |
Source: Public Records
Tax History Compared to Growth
Tax History
| Year | Tax Paid | Tax Assessment Tax Assessment Total Assessment is a certain percentage of the fair market value that is determined by local assessors to be the total taxable value of land and additions on the property. | Land | Improvement |
|---|---|---|---|---|
| 2025 | $2,436 | $24,172 | $5,306 | $18,866 |
| 2024 | $2,436 | $23,468 | $5,151 | $18,317 |
| 2023 | $2,436 | $22,784 | $5,256 | $17,528 |
| 2022 | $2,294 | $22,121 | $5,946 | $16,175 |
| 2021 | $2,226 | $21,477 | $5,130 | $16,347 |
| 2020 | $2,491 | $21,048 | $5,130 | $15,918 |
| 2019 | $2,534 | $21,032 | $4,964 | $16,068 |
| 2018 | $2,229 | $20,419 | $4,873 | $15,546 |
| 2017 | $2,369 | $19,824 | $4,721 | $15,103 |
| 2016 | $2,138 | $19,246 | $5,078 | $14,168 |
| 2015 | $2,057 | $18,687 | $4,996 | $13,691 |
| 2014 | $2,057 | $18,142 | $4,820 | $13,322 |
Source: Public Records
Map
Nearby Homes
- 609 S County Line Ave
- 813 Summer Oaks Dr
- Yellowstone Plan at Southern Trace
- Williamette Plan at Southern Trace
- White River Plan at Southern Trace
- Wallowa Plan at Southern Trace
- Umatilla Plan at Southern Trace
- Talladega Plan at Southern Trace
- Sierra Plan at Southern Trace
- Rio Grande Plan at Southern Trace
- Prescott Plan at Southern Trace
- Ouachita Plan at Southern Trace
- Nez Perce Plan at Southern Trace
- Medicine Bow Plan at Southern Trace
- Malheur Plan at Southern Trace
- Lincoln Plan at Southern Trace
- Klamath Plan at Southern Trace
- Hiawatha Plan at Southern Trace
- Gallatin Plan at Southern Trace
- Fremont Plan at Southern Trace
- 813 Autumn Way
- 716 Autumn Way
- 706 Autumn Way
- 716 Summer Oaks Dr
- 812 Autumn Way
- 700 Summer Oaks Dr
- 901 Autumn Way
- 609 S County Line Ave
- 620 Summer Oaks Dr
- 706 Summer Oaks Dr
- 900 Autumn Way
- 522 Summer Oaks Dr
- 717 Summer Oaks Dr
- 707 Summer Oaks Dr
- 713 Autumn Way
- 916 Autumn Way
- 600 S County Line Ave
- 916 Summer Oaks Dr
- 506 Summer Oaks Dr