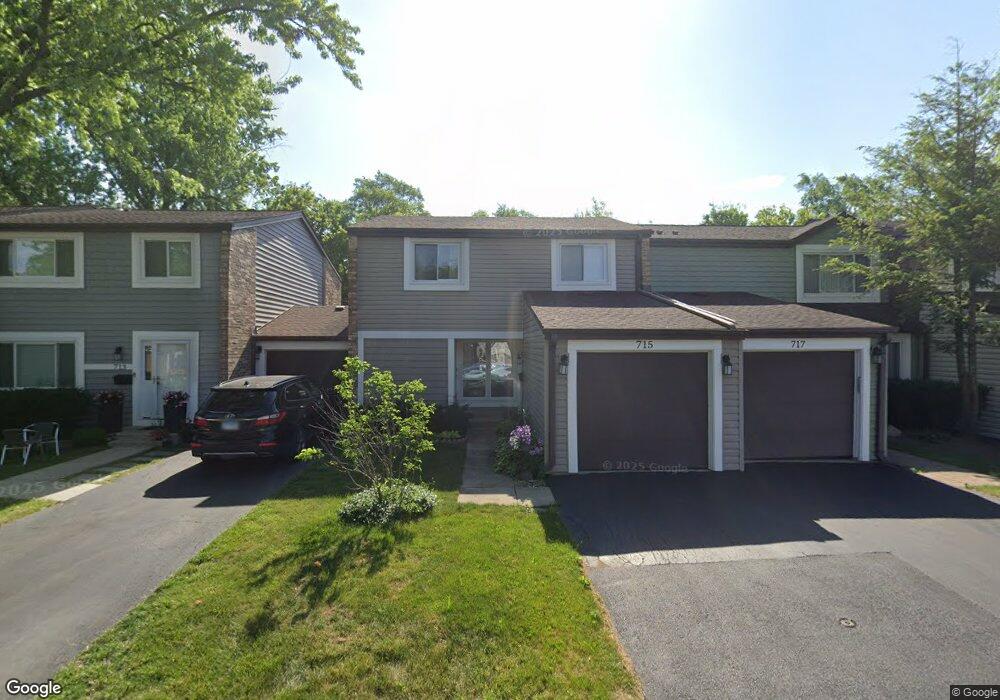
715 Bayside Ct Unit 2 Wheeling, IL 60090
Estimated Value: $305,000 - $329,000
3
Beds
3
Baths
1,495
Sq Ft
$213/Sq Ft
Est. Value
About This Home
This home is located at 715 Bayside Ct Unit 2, Wheeling, IL 60090 and is currently estimated at $318,999, approximately $213 per square foot. 715 Bayside Ct Unit 2 is a home located in Cook County with nearby schools including Booth Tarkington Elementary School, Jack London Middle School, and Wheeling High School.
Ownership History
Date
Name
Owned For
Owner Type
Purchase Details
Closed on
Apr 26, 2013
Sold by
Rubin Roman and Rubin Tamara
Bought by
Rubin Roman and Rubin Tamara
Current Estimated Value
Purchase Details
Closed on
Apr 7, 2004
Sold by
Rubin Roman and Budko Tamara
Bought by
Rubin Roman and Rubin Tamara
Purchase Details
Closed on
Apr 28, 1999
Sold by
Berg Bruce M and Berg Eleanor R
Bought by
Rubin Roman and Budko Tamra
Home Financials for this Owner
Home Financials are based on the most recent Mortgage that was taken out on this home.
Original Mortgage
$128,250
Outstanding Balance
$30,491
Interest Rate
7.05%
Estimated Equity
$288,508
Purchase Details
Closed on
Dec 3, 1993
Sold by
Krasner Alexander and Krasner Yevgeniya
Bought by
Berg Bruce M and Berg Eleanor R
Home Financials for this Owner
Home Financials are based on the most recent Mortgage that was taken out on this home.
Original Mortgage
$112,500
Interest Rate
6.95%
Create a Home Valuation Report for This Property
The Home Valuation Report is an in-depth analysis detailing your home's value as well as a comparison with similar homes in the area
Home Values in the Area
Average Home Value in this Area
Purchase History
| Date | Buyer | Sale Price | Title Company |
|---|---|---|---|
| Rubin Roman | -- | Proper Title | |
| Rubin Roman | -- | -- | |
| Rubin Roman | $142,500 | -- | |
| Berg Bruce M | $83,333 | -- |
Source: Public Records
Mortgage History
| Date | Status | Borrower | Loan Amount |
|---|---|---|---|
| Open | Rubin Roman | $128,250 | |
| Previous Owner | Berg Bruce M | $112,500 |
Source: Public Records
Tax History
| Year | Tax Paid | Tax Assessment Tax Assessment Total Assessment is a certain percentage of the fair market value that is determined by local assessors to be the total taxable value of land and additions on the property. | Land | Improvement |
|---|---|---|---|---|
| 2025 | $1,962 | $25,000 | $3,578 | $21,422 |
| 2024 | $1,962 | $22,000 | $4,000 | $18,000 |
| 2023 | $1,930 | $22,000 | $4,000 | $18,000 |
| 2022 | $1,930 | $22,000 | $4,000 | $18,000 |
| 2021 | $2,179 | $16,928 | $4,583 | $12,345 |
| 2020 | $1,977 | $16,928 | $4,583 | $12,345 |
| 2019 | $1,984 | $18,809 | $4,583 | $14,226 |
| 2018 | $2,978 | $15,031 | $3,968 | $11,063 |
| 2017 | $2,131 | $15,031 | $3,968 | $11,063 |
| 2016 | $4,385 | $17,423 | $3,968 | $13,455 |
| 2015 | $3,159 | $13,362 | $3,465 | $9,897 |
| 2014 | $3,670 | $14,962 | $3,465 | $11,497 |
| 2013 | $4,226 | $15,799 | $3,465 | $12,334 |
Source: Public Records
Map
Nearby Homes
- 709 Lakeside Circle Dr Unit 2
- 2812 Jackson Dr
- 2822 Jackson Dr
- 791 Lakeside Circle Dr Unit 1
- 1507 Clearwater Ln Unit 1
- 528 Surf Ct
- 3026 Jackson Dr
- 1504 Chippewa Trail
- 1014 Lakeland Ct Unit 2A
- 1025 Cottonwood Ct Unit 2AR
- 2643 N Prindle Ave
- 1030 Cottonwood Ct Unit 2A
- 2604 N Prindle Ave
- 413 Buffalo Trail Unit 10601
- 404 Arrow Trail Unit 10103
- 1810 E Waverly Dr
- 200 Lake Blvd Unit 402
- 175 Lake Blvd Unit 349
- 175 Lake Blvd Unit 345
- 1530 E Fleming Dr S
- 717 Bayside Ct Unit 2
- 713 Bayside Ct
- 719 Bayside Ct Unit 2
- 711 Bayside Ct Unit 2
- 709 Bayside Ct
- 707 Bayside Ct
- 716 Bayside Ct
- 714 Bayside Ct
- 718 Bayside Ct Unit 2
- 712 Bayside Ct Unit 2
- 720 Bayside Ct
- 705 Bayside Ct Unit 2
- 710 Bayside Ct Unit 2
- 1403 Bayside Ln Unit 2
- 1401 Bayside Ln Unit 2
- 1405 Bayside Ln Unit 2
- 708 Bayside Ct Unit 2
- 708 Bayside Ct Unit 1
- 1407 Bayside Ln Unit 2
- 1409 Bayside Ln Unit 2
Your Personal Tour Guide
Ask me questions while you tour the home.