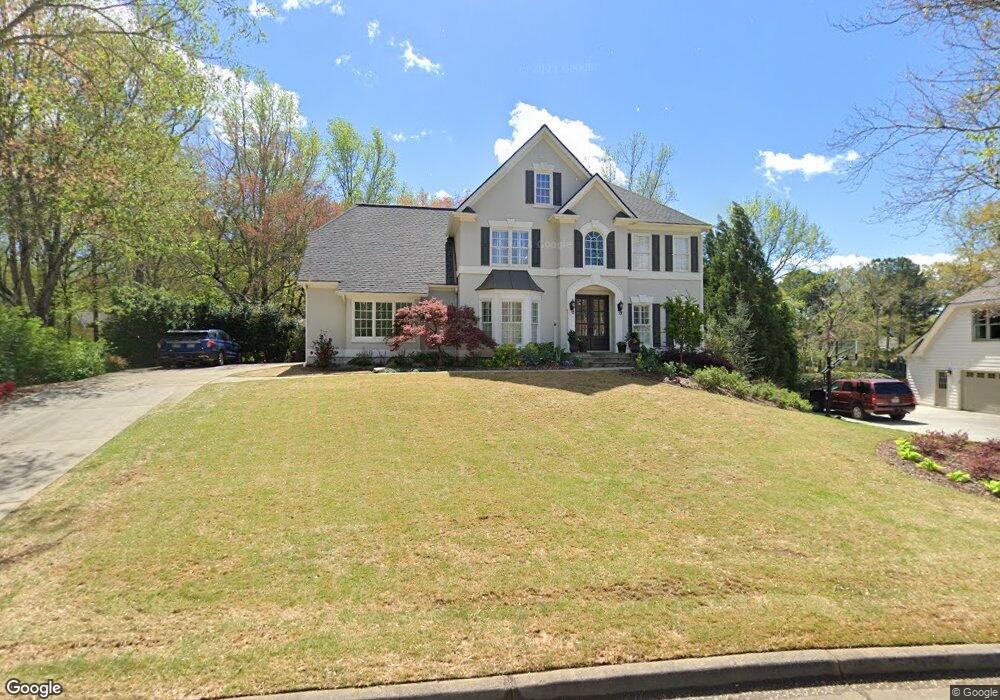
715 Briars Bend Alpharetta, GA 30004
Estimated Value: $850,232 - $894,000
4
Beds
3
Baths
2,913
Sq Ft
$300/Sq Ft
Est. Value
About This Home
This home is located at 715 Briars Bend, Alpharetta, GA 30004 and is currently estimated at $874,308, approximately $300 per square foot. 715 Briars Bend is a home located in Fulton County with nearby schools including Crabapple Crossing Elementary School, Northwestern Middle School, and Milton High School.
Ownership History
Date
Name
Owned For
Owner Type
Purchase Details
Closed on
Nov 10, 1994
Sold by
Fetzer Props Inc
Bought by
Lawton Edward Anne
Current Estimated Value
Home Financials for this Owner
Home Financials are based on the most recent Mortgage that was taken out on this home.
Original Mortgage
$162,250
Interest Rate
9.23%
Purchase Details
Closed on
Jul 2, 1994
Sold by
Crabapple Props Ltd
Bought by
Fetzer Props Ltd
Home Financials for this Owner
Home Financials are based on the most recent Mortgage that was taken out on this home.
Original Mortgage
$147,000
Interest Rate
8.39%
Mortgage Type
Construction
Create a Home Valuation Report for This Property
The Home Valuation Report is an in-depth analysis detailing your home's value as well as a comparison with similar homes in the area
Home Values in the Area
Average Home Value in this Area
Purchase History
| Date | Buyer | Sale Price | Title Company |
|---|---|---|---|
| Lawton Edward Anne | $202,900 | -- | |
| Fetzer Props Ltd | $44,000 | -- |
Source: Public Records
Mortgage History
| Date | Status | Borrower | Loan Amount |
|---|---|---|---|
| Closed | Lawton Edward Anne | $162,250 | |
| Previous Owner | Fetzer Props Ltd | $147,000 |
Source: Public Records
Tax History
| Year | Tax Paid | Tax Assessment Tax Assessment Total Assessment is a certain percentage of the fair market value that is determined by local assessors to be the total taxable value of land and additions on the property. | Land | Improvement |
|---|---|---|---|---|
| 2025 | $1,044 | $338,800 | $69,600 | $269,200 |
| 2023 | $9,347 | $331,160 | $73,920 | $257,240 |
| 2022 | $4,458 | $239,840 | $53,280 | $186,560 |
| 2021 | $5,316 | $222,040 | $51,320 | $170,720 |
| 2020 | $5,341 | $219,400 | $50,720 | $168,680 |
| 2019 | $867 | $205,920 | $48,680 | $157,240 |
| 2018 | $4,395 | $179,760 | $39,760 | $140,000 |
| 2017 | $4,392 | $172,880 | $38,240 | $134,640 |
| 2016 | $4,370 | $172,880 | $38,240 | $134,640 |
| 2015 | $5,180 | $172,880 | $38,240 | $134,640 |
| 2014 | $3,660 | $132,160 | $21,880 | $110,280 |
Source: Public Records
Map
Nearby Homes
- 785 Briars Bend
- 2020 Davis Island
- 1354 Salem Dr
- 1051 Colony Dr
- 1050 Little River Ln
- 1770 Mayfield Rd
- 3043 Steeplechase
- 3058 Steeplechase Unit 4
- 1360 Bethany Ct
- 3042 Steeplechase Unit 2
- 3018 Steeplechase
- 1715 Bates Rd
- 1840 Evergreen Ln Unit 1
- 12245 Greenmont Walk
- 12455 Pindell Cir
- 1880 Mayfield Rd
- 3051 Maple Ln
- 150 Cobblestone Way
- 1805 Broadwell Oaks Dr
- Hillstone with Basement Plan at Emberly - Monarch Collection
- 725 Briars Bend
- 705 Briars Bend
- 700 Briars Bend
- 3060 Brierfield Lake
- 695 Briars Bend
- 750 Briars Bend
- 690 Briars Bend
- 735 Briars Bend
- 790 Briars Bend
- 3050 Brierfield Lake
- 685 Briars Bend
- 745 Briars Bend
- 680 Briars Bend
- 1526 Cumberland Ct
- 3065 Brierfield Lake
- 800 Briars Bend
- 1517 Cumberland Ct
- 1420 Princeton Ct
- 3030 Brierfield Lake
- 3055 Brierfield Lake
Your Personal Tour Guide
Ask me questions while you tour the home.