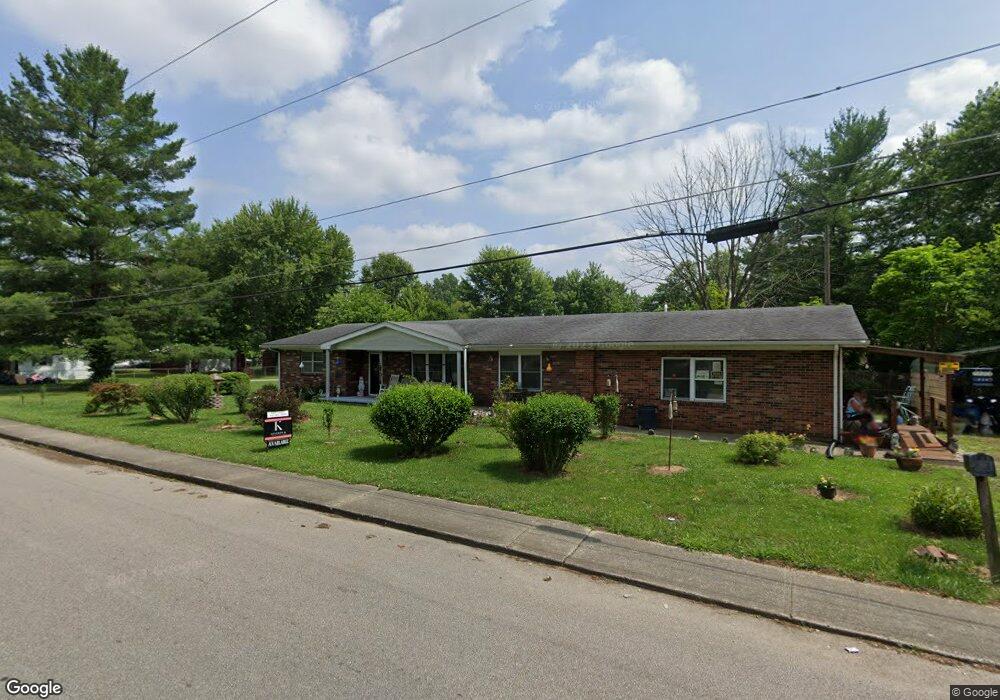
715 Broadway St Austin, IN 47102
Estimated Value: $204,000 - $224,000
4
Beds
3
Baths
2,454
Sq Ft
$87/Sq Ft
Est. Value
About This Home
This home is located at 715 Broadway St, Austin, IN 47102 and is currently estimated at $213,804, approximately $87 per square foot. 715 Broadway St is a home located in Scott County with nearby schools including Austin Elementary School, Austin Middle School, and Austin High School.
Ownership History
Date
Name
Owned For
Owner Type
Purchase Details
Closed on
May 31, 2024
Sold by
White Jessie Faye
Bought by
Melton Toni Michelle
Current Estimated Value
Purchase Details
Closed on
Dec 17, 2010
Sold by
Goodin Berley and Estate Of Clarice Mae Goodin
Bought by
White Johnnie and White Jessie Faye
Home Financials for this Owner
Home Financials are based on the most recent Mortgage that was taken out on this home.
Original Mortgage
$50,000
Interest Rate
4.22%
Mortgage Type
New Conventional
Create a Home Valuation Report for This Property
The Home Valuation Report is an in-depth analysis detailing your home's value as well as a comparison with similar homes in the area
Home Values in the Area
Average Home Value in this Area
Purchase History
| Date | Buyer | Sale Price | Title Company |
|---|---|---|---|
| Melton Toni Michelle | $190,000 | Momentum Title Agency | |
| White Johnnie | -- | None Available |
Source: Public Records
Mortgage History
| Date | Status | Borrower | Loan Amount |
|---|---|---|---|
| Previous Owner | White Johnnie | $50,000 |
Source: Public Records
Tax History Compared to Growth
Tax History
| Year | Tax Paid | Tax Assessment Tax Assessment Total Assessment is a certain percentage of the fair market value that is determined by local assessors to be the total taxable value of land and additions on the property. | Land | Improvement |
|---|---|---|---|---|
| 2024 | $1,017 | $103,200 | $20,000 | $83,200 |
| 2023 | $1,072 | $105,100 | $20,000 | $85,100 |
| 2022 | $726 | $97,500 | $20,000 | $77,500 |
| 2021 | $568 | $90,600 | $20,000 | $70,600 |
| 2020 | $679 | $95,900 | $20,000 | $75,900 |
| 2019 | $668 | $95,900 | $20,000 | $75,900 |
| 2018 | $757 | $100,400 | $20,000 | $80,400 |
| 2017 | $759 | $101,000 | $20,000 | $81,000 |
| 2016 | $554 | $90,400 | $13,500 | $76,900 |
| 2014 | $850 | $104,800 | $29,500 | $75,300 |
| 2013 | $850 | $119,500 | $29,600 | $89,900 |
Source: Public Records
Map
Nearby Homes