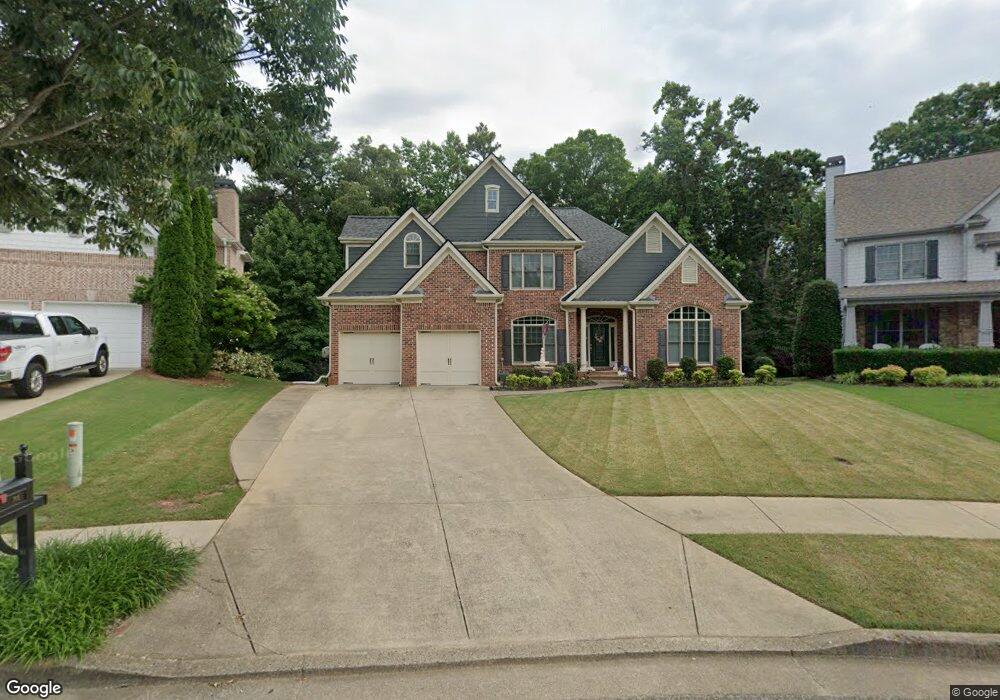
715 Crescent Cir Canton, GA 30115
Estimated Value: $603,581 - $723,000
5
Beds
5
Baths
3,048
Sq Ft
$218/Sq Ft
Est. Value
About This Home
This home is located at 715 Crescent Cir, Canton, GA 30115 and is currently estimated at $663,291, approximately $217 per square foot. 715 Crescent Cir is a home located in Cherokee County with nearby schools including Indian Knoll Elementary School, Rusk Middle School, and Sequoyah High School.
Ownership History
Date
Name
Owned For
Owner Type
Purchase Details
Closed on
Jan 12, 2024
Sold by
Brunk Joanne D
Bought by
Brunk Joanne Davidson Trust and Brunk Richard Lee Trust
Current Estimated Value
Purchase Details
Closed on
Jun 29, 2007
Sold by
Sanal Salahattin M and Sanal Nurten
Bought by
Brunk Richard L and Brunk Joanne D
Home Financials for this Owner
Home Financials are based on the most recent Mortgage that was taken out on this home.
Original Mortgage
$142,000
Interest Rate
6.35%
Mortgage Type
New Conventional
Purchase Details
Closed on
Mar 30, 2005
Sold by
Westminster Homes Ltd
Bought by
Sanal Salahattin M and Sanal Nurten
Home Financials for this Owner
Home Financials are based on the most recent Mortgage that was taken out on this home.
Original Mortgage
$38,760
Interest Rate
5.88%
Mortgage Type
New Conventional
Create a Home Valuation Report for This Property
The Home Valuation Report is an in-depth analysis detailing your home's value as well as a comparison with similar homes in the area
Home Values in the Area
Average Home Value in this Area
Purchase History
| Date | Buyer | Sale Price | Title Company |
|---|---|---|---|
| Brunk Joanne Davidson Trust | -- | -- | |
| Brunk Richard L | $410,000 | -- | |
| Sanal Salahattin M | $397,100 | -- |
Source: Public Records
Mortgage History
| Date | Status | Borrower | Loan Amount |
|---|---|---|---|
| Previous Owner | Brunk Richard L | $142,000 | |
| Previous Owner | Sanal Salahattin M | $38,760 | |
| Previous Owner | Sanal Salahattin M | $317,653 |
Source: Public Records
Tax History
| Year | Tax Paid | Tax Assessment Tax Assessment Total Assessment is a certain percentage of the fair market value that is determined by local assessors to be the total taxable value of land and additions on the property. | Land | Improvement |
|---|---|---|---|---|
| 2025 | $5,934 | $238,000 | $54,000 | $184,000 |
| 2024 | $1,783 | $222,960 | $54,000 | $168,960 |
| 2023 | $1,614 | $225,120 | $54,000 | $171,120 |
| 2022 | $1,692 | $195,200 | $40,000 | $155,200 |
| 2021 | $792 | $150,960 | $32,400 | $118,560 |
| 2020 | $1,450 | $147,400 | $31,200 | $116,200 |
| 2019 | $797 | $144,680 | $31,200 | $113,480 |
| 2018 | $1,486 | $144,440 | $31,200 | $113,240 |
| 2017 | $1,408 | $343,500 | $31,200 | $106,200 |
| 2016 | $843 | $346,500 | $31,200 | $107,400 |
| 2015 | $778 | $312,100 | $26,000 | $98,840 |
| 2014 | $799 | $319,800 | $26,000 | $101,920 |
Source: Public Records
Map
Nearby Homes
- 810 Ravenstone Way
- 242 Harmony Lake Dr
- 408 Long Branch Way
- 212 Reserve Crossing
- 778 Crescent Cir
- 243 Harmony Lake Dr
- 207 Reserve Crossing
- 333 Reserve Overlook
- 213 Whitetail Cir
- 626 Royal Crest Ct
- 367 Reserve Overlook
- 292 Harmony Lake Dr
- 642 Royal Crest Ct
- 200 Cherokee Reserve Cir
- 241 Royal Crescent Terrace
- 405 Royal Crescent Ln E
- 411 Royal Crescent Ln E
- 146 Edgewater Trail
- 417 Darnell Rd
- 505 Hayes Ln
- 717 Crescent Cir
- 713 Crescent Cir
- 719 Crescent Cir
- 711 Crescent Cir
- 721 Crescent Cir
- 709 Crescent Cir
- 907 Landsdowne Cove
- 905 Landsdowne Cove
- 723 Crescent Cir
- 707 Crescent Cir
- 705 Crescent Cir
- 911 Landsdowne Cove
- 903 Landsdowne Cove
- 716 Crescent Cir
- 806 Ravenstone Way
- 718 Crescent Cir
- 714 Crescent Cir
- 703 Crescent Cir
- 725 Crescent Cir
- 712 Crescent Cir
Your Personal Tour Guide
Ask me questions while you tour the home.