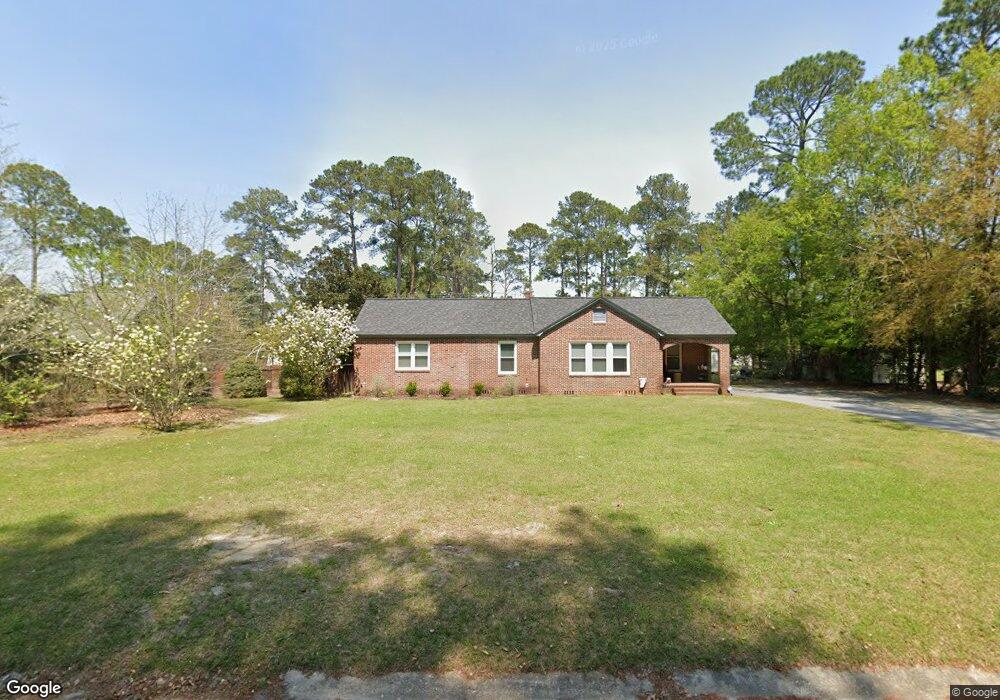
715 E 19th Ave Cordele, GA 31015
Estimated Value: $169,432 - $188,000
3
Beds
2
Baths
1,667
Sq Ft
$106/Sq Ft
Est. Value
About This Home
This home is located at 715 E 19th Ave, Cordele, GA 31015 and is currently estimated at $177,358, approximately $106 per square foot. 715 E 19th Ave is a home located in Crisp County with nearby schools including Crisp County Elementary School, Crisp County Primary School, and Crisp County Middle School.
Ownership History
Date
Name
Owned For
Owner Type
Purchase Details
Closed on
Jun 22, 2006
Sold by
Nelson Brian C
Bought by
Pollock Valeria H
Current Estimated Value
Home Financials for this Owner
Home Financials are based on the most recent Mortgage that was taken out on this home.
Original Mortgage
$78,000
Outstanding Balance
$45,314
Interest Rate
6.55%
Mortgage Type
New Conventional
Estimated Equity
$132,044
Purchase Details
Closed on
May 19, 2005
Sold by
Lawrence Flavil P
Bought by
Nelson Brian C and Nelson Lesli H
Home Financials for this Owner
Home Financials are based on the most recent Mortgage that was taken out on this home.
Original Mortgage
$81,900
Interest Rate
5.74%
Mortgage Type
New Conventional
Purchase Details
Closed on
Oct 22, 1955
Bought by
Lawrence Mrs George
Create a Home Valuation Report for This Property
The Home Valuation Report is an in-depth analysis detailing your home's value as well as a comparison with similar homes in the area
Purchase History
| Date | Buyer | Sale Price | Title Company |
|---|---|---|---|
| Pollock Valeria H | $97,500 | -- | |
| Nelson Brian C | $75,000 | -- | |
| Lawrence Mrs George | -- | -- |
Source: Public Records
Mortgage History
| Date | Status | Borrower | Loan Amount |
|---|---|---|---|
| Open | Pollock Valeria H | $78,000 | |
| Previous Owner | Nelson Brian C | $81,900 |
Source: Public Records
Tax History
| Year | Tax Paid | Tax Assessment Tax Assessment Total Assessment is a certain percentage of the fair market value that is determined by local assessors to be the total taxable value of land and additions on the property. | Land | Improvement |
|---|---|---|---|---|
| 2025 | $2,084 | $62,209 | $4,096 | $58,113 |
| 2024 | $1,966 | $56,242 | $4,096 | $52,146 |
| 2023 | $1,871 | $51,321 | $2,048 | $49,273 |
| 2022 | $1,225 | $48,337 | $2,048 | $46,289 |
| 2021 | $1,200 | $45,354 | $2,048 | $43,306 |
| 2020 | $1,220 | $45,354 | $2,048 | $43,306 |
| 2019 | $1,230 | $45,354 | $2,048 | $43,306 |
| 2018 | $1,245 | $44,227 | $3,891 | $40,336 |
| 2017 | $1,796 | $44,227 | $3,891 | $40,336 |
| 2016 | $1,249 | $44,227 | $3,891 | $40,336 |
| 2015 | -- | $44,228 | $3,891 | $40,336 |
| 2014 | -- | $44,228 | $3,891 | $40,336 |
| 2013 | -- | $44,227 | $3,891 | $40,336 |
Source: Public Records
Map
Nearby Homes
- 716 E 18th Ave
- 720 E 20th Ave
- 1002 Camellia Dr
- 715 E 17th Ave
- 709 Fleming Rd
- 912 Rose Ln
- 1206 Fleming Rd
- 1012 E 21st Ave
- E 8th Ave
- 812 E 14th Ave
- 723 E 24th Ave
- 807 E 14th Ave
- 612 E 12th Ave
- 511 E 13th Ave
- 120 Edgewood Dr
- 312 E 14th Ave
- 601 E 26th Ave
- 708 E 26th Ave Unit 4&5
- 708 E 26th Ave
- 614 E 26th Ave
Your Personal Tour Guide
Ask me questions while you tour the home.