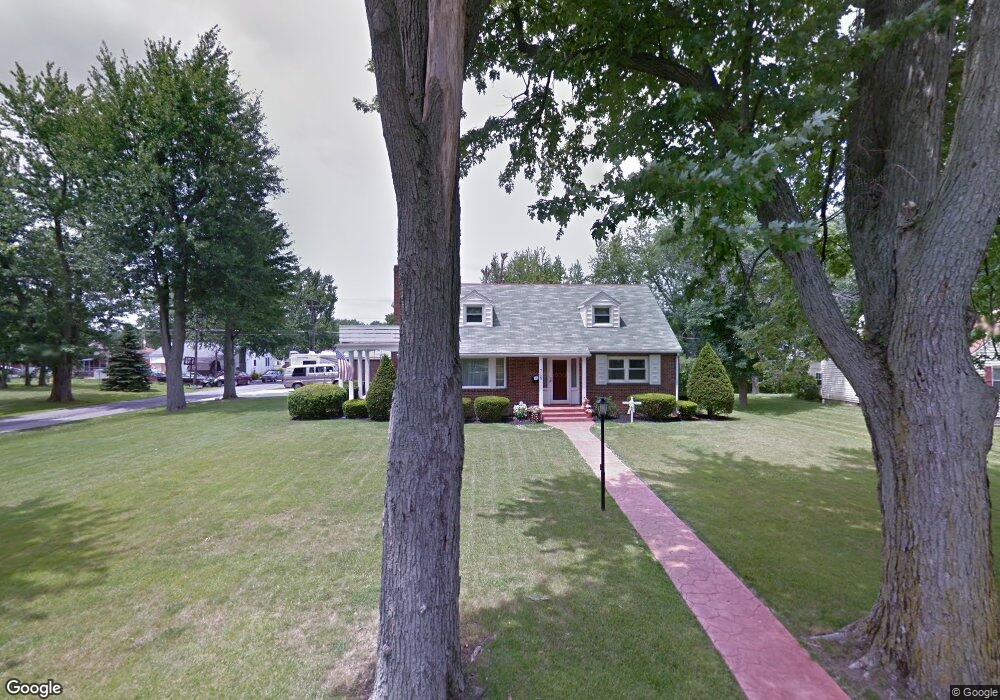
715 Gilmore St Kenton, OH 43326
Estimated Value: $163,000 - $274,000
4
Beds
2
Baths
1,200
Sq Ft
$192/Sq Ft
Est. Value
About This Home
This home is located at 715 Gilmore St, Kenton, OH 43326 and is currently estimated at $230,753, approximately $192 per square foot. 715 Gilmore St is a home located in Hardin County with nearby schools including Kenton Elementary School, Kenton Middle School, and Kenton High School.
Ownership History
Date
Name
Owned For
Owner Type
Purchase Details
Closed on
Jan 21, 2011
Sold by
Osborn Phillip E and Osborn Carol S
Bought by
Bell Jason D and Bell Whitney A
Current Estimated Value
Home Financials for this Owner
Home Financials are based on the most recent Mortgage that was taken out on this home.
Original Mortgage
$70,000
Outstanding Balance
$47,426
Interest Rate
4.65%
Mortgage Type
Unknown
Estimated Equity
$183,327
Purchase Details
Closed on
Oct 9, 2010
Sold by
Finerty Ann H
Bought by
Bell Jason D and Bell Whitney
Home Financials for this Owner
Home Financials are based on the most recent Mortgage that was taken out on this home.
Original Mortgage
$70,000
Interest Rate
4.36%
Mortgage Type
Unknown
Purchase Details
Closed on
May 12, 2010
Sold by
Finerty Ann H
Bought by
Bell Jason D and Bell Whitney
Purchase Details
Closed on
Nov 20, 1996
Bought by
Finerty Ann H Trust
Create a Home Valuation Report for This Property
The Home Valuation Report is an in-depth analysis detailing your home's value as well as a comparison with similar homes in the area
Home Values in the Area
Average Home Value in this Area
Purchase History
| Date | Buyer | Sale Price | Title Company |
|---|---|---|---|
| Bell Jason D | -- | None Available | |
| Bell Jason D | $129,900 | None Available | |
| Bell Jason D | $129,900 | None Available | |
| Finerty Ann H Trust | -- | -- |
Source: Public Records
Mortgage History
| Date | Status | Borrower | Loan Amount |
|---|---|---|---|
| Open | Bell Jason D | $70,000 | |
| Previous Owner | Bell Jason D | $70,000 |
Source: Public Records
Tax History Compared to Growth
Tax History
| Year | Tax Paid | Tax Assessment Tax Assessment Total Assessment is a certain percentage of the fair market value that is determined by local assessors to be the total taxable value of land and additions on the property. | Land | Improvement |
|---|---|---|---|---|
| 2024 | $2,940 | $68,440 | $7,980 | $60,460 |
| 2023 | $2,940 | $68,440 | $7,980 | $60,460 |
| 2022 | $2,718 | $58,900 | $5,260 | $53,640 |
| 2021 | $2,728 | $58,900 | $5,260 | $53,640 |
| 2020 | $2,365 | $58,900 | $5,260 | $53,640 |
| 2019 | $1,879 | $48,290 | $5,010 | $43,280 |
| 2018 | $1,883 | $48,290 | $5,010 | $43,280 |
| 2017 | $1,775 | $48,290 | $5,010 | $43,280 |
| 2016 | $1,703 | $45,580 | $5,320 | $40,260 |
| 2015 | $1,643 | $45,580 | $5,320 | $40,260 |
| 2014 | $1,681 | $45,580 | $5,320 | $40,260 |
| 2013 | $1,607 | $42,350 | $5,320 | $37,030 |
Source: Public Records
Map
Nearby Homes