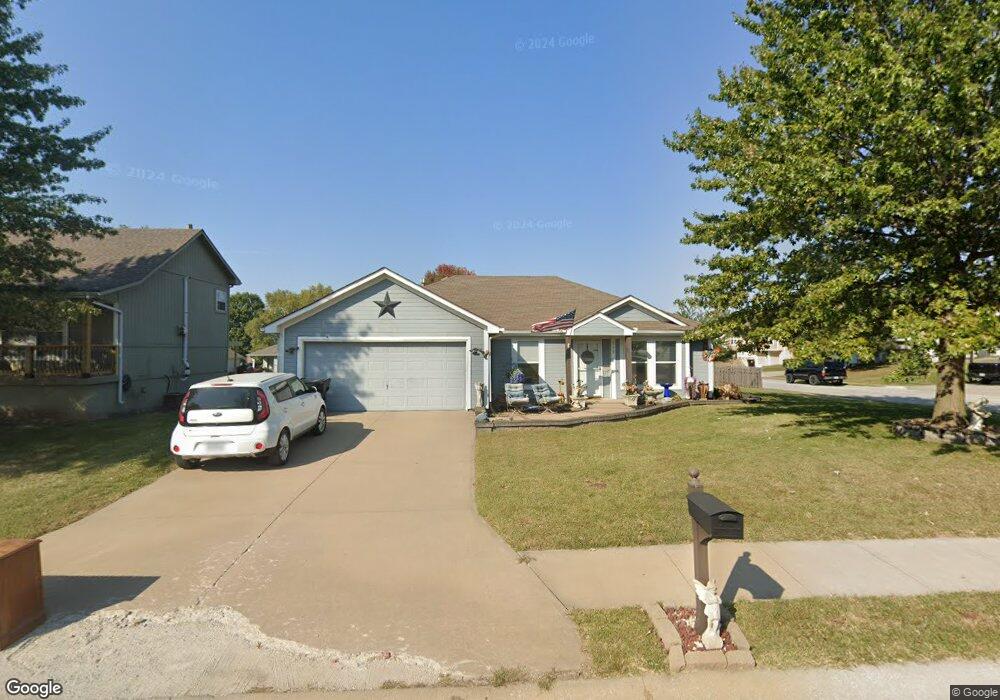
715 Henley Dr Pleasant Hill, MO 64080
Estimated Value: $250,000 - $290,000
3
Beds
2
Baths
1,333
Sq Ft
$207/Sq Ft
Est. Value
About This Home
This home is located at 715 Henley Dr, Pleasant Hill, MO 64080 and is currently estimated at $275,558, approximately $206 per square foot. 715 Henley Dr is a home located in Cass County with nearby schools including Pleasant Hill Primary School, Pleasant Hill Elementary School, and Pleasant Hill Intermediate School.
Ownership History
Date
Name
Owned For
Owner Type
Purchase Details
Closed on
Sep 16, 2022
Sold by
Rau Albert D and Revoc Margaret
Bought by
Cook Kent N and Cook Nicole L
Current Estimated Value
Purchase Details
Closed on
Sep 30, 2020
Sold by
Rau Albert D and Rau Margaret J
Bought by
Rau Albert D and Rau Amended Margaret
Purchase Details
Closed on
Sep 23, 2011
Sold by
Boney Dolores Jean
Bought by
Bryant Vickie and Rau Margaret J
Purchase Details
Closed on
May 21, 2009
Sold by
Shoaf Roy G and Shoaf Kala R
Bought by
Boney Dolores J
Purchase Details
Closed on
Jan 11, 2006
Sold by
Shoaf Roy G and Shoaf Kila R
Bought by
Shoaf Roy G and Shoaf Kila R
Home Financials for this Owner
Home Financials are based on the most recent Mortgage that was taken out on this home.
Original Mortgage
$135,000
Interest Rate
8.75%
Mortgage Type
Adjustable Rate Mortgage/ARM
Create a Home Valuation Report for This Property
The Home Valuation Report is an in-depth analysis detailing your home's value as well as a comparison with similar homes in the area
Home Values in the Area
Average Home Value in this Area
Purchase History
| Date | Buyer | Sale Price | Title Company |
|---|---|---|---|
| Cook Kent N | -- | Continental Title | |
| Rau Albert D | -- | None Available | |
| Bryant Vickie | -- | Coflie Land Title Inc | |
| Boney Dolores J | -- | None Available | |
| Shoaf Roy G | -- | -- |
Source: Public Records
Mortgage History
| Date | Status | Borrower | Loan Amount |
|---|---|---|---|
| Previous Owner | Shoaf Roy G | $135,000 |
Source: Public Records
Tax History Compared to Growth
Tax History
| Year | Tax Paid | Tax Assessment Tax Assessment Total Assessment is a certain percentage of the fair market value that is determined by local assessors to be the total taxable value of land and additions on the property. | Land | Improvement |
|---|---|---|---|---|
| 2024 | $2,084 | $28,900 | $4,890 | $24,010 |
| 2023 | $2,069 | $28,900 | $4,890 | $24,010 |
| 2022 | $1,884 | $25,820 | $4,890 | $20,930 |
| 2021 | $1,832 | $25,820 | $4,890 | $20,930 |
| 2020 | $1,741 | $25,130 | $4,890 | $20,240 |
| 2019 | $1,718 | $25,130 | $4,890 | $20,240 |
| 2018 | $1,560 | $22,510 | $4,200 | $18,310 |
| 2017 | $1,489 | $22,510 | $4,200 | $18,310 |
| 2016 | $1,489 | $21,410 | $4,200 | $17,210 |
| 2015 | $1,508 | $21,410 | $4,200 | $17,210 |
| 2014 | $1,515 | $21,410 | $4,200 | $17,210 |
| 2013 | -- | $21,410 | $4,200 | $17,210 |
Source: Public Records
Map
Nearby Homes
- 704 Terry Dr
- 631 Terry Dr
- 0 E 163rd St Unit HMS2499275
- 25.8+/- Acres E 163rd St
- 2008 Cypress Way
- 207 Breezeway Ln
- 2009 Ridge Tree Dr
- 1309 Pinoak Ct
- 1202 Ashford St
- 1908 Owen Dr
- 1918 Owen Dr
- 2004 Owen Dr
- 1807 Mystery Hill Dr
- 1202 Morgan Dr
- 1405 E State Route Vv
- 1521 Lexington Rd
- 16025 Knorpp Rd
- 1307 Deena St
- 29 Acres E State Route Vv
- 1507 Trail Ridge Dr