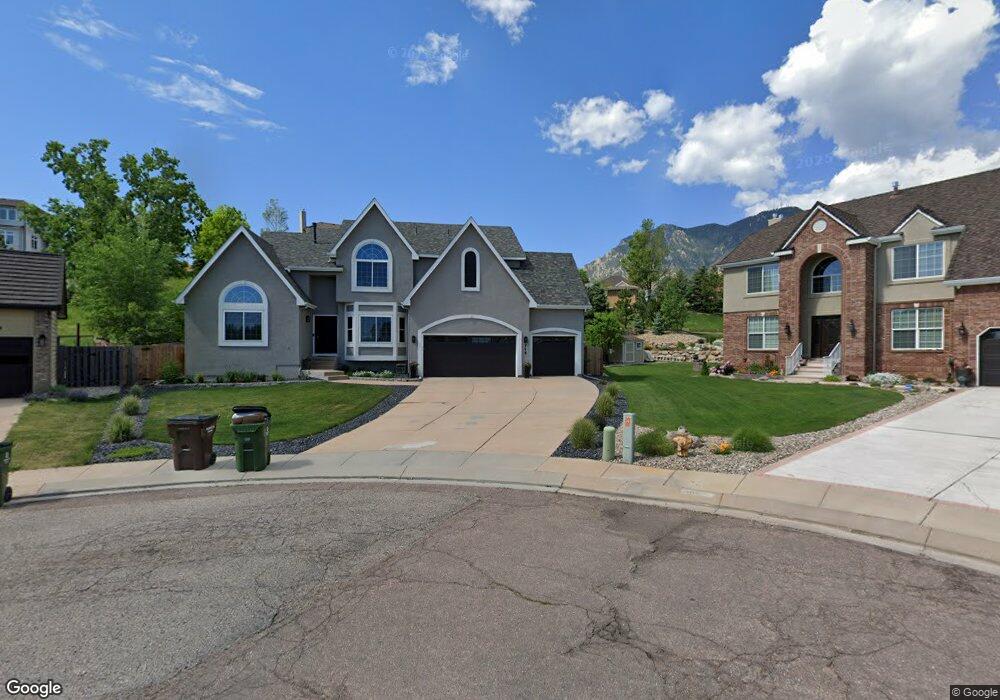
715 Herbglen Ct Colorado Springs, CO 80906
Broadmoor Bluff NeighborhoodEstimated Value: $844,000 - $936,000
6
Beds
5
Baths
4,852
Sq Ft
$183/Sq Ft
Est. Value
About This Home
This home is located at 715 Herbglen Ct, Colorado Springs, CO 80906 and is currently estimated at $889,178, approximately $183 per square foot. 715 Herbglen Ct is a home located in El Paso County with nearby schools including Pinon Valley Elementary School, Cheyenne Mountain Junior High School, and Cheyenne Mountain High School.
Ownership History
Date
Name
Owned For
Owner Type
Purchase Details
Closed on
Jul 22, 2020
Sold by
Rogers Hyon Suk
Bought by
Mcdowell Travis L and Mcdowell Sompong
Current Estimated Value
Home Financials for this Owner
Home Financials are based on the most recent Mortgage that was taken out on this home.
Original Mortgage
$305,000
Outstanding Balance
$270,956
Interest Rate
3.2%
Mortgage Type
New Conventional
Estimated Equity
$618,222
Purchase Details
Closed on
Apr 30, 2002
Sold by
Winkleman Lisa A and Lavender Lisa A
Bought by
Rogers Hyon Suk
Home Financials for this Owner
Home Financials are based on the most recent Mortgage that was taken out on this home.
Original Mortgage
$295,260
Interest Rate
6.5%
Purchase Details
Closed on
Mar 30, 1998
Sold by
Acuff Homes Inc
Bought by
Lavender Lisa A
Purchase Details
Closed on
Feb 11, 1997
Sold by
Broadmoor Glen South Llc
Bought by
Acuff Homes Inc
Create a Home Valuation Report for This Property
The Home Valuation Report is an in-depth analysis detailing your home's value as well as a comparison with similar homes in the area
Home Values in the Area
Average Home Value in this Area
Purchase History
| Date | Buyer | Sale Price | Title Company |
|---|---|---|---|
| Mcdowell Travis L | $605,000 | Empire Title Co Springs Llc | |
| Rogers Hyon Suk | $399,000 | Security Title | |
| Lavender Lisa A | $296,013 | Title America | |
| Acuff Homes Inc | $46,800 | Land Title |
Source: Public Records
Mortgage History
| Date | Status | Borrower | Loan Amount |
|---|---|---|---|
| Open | Mcdowell Travis L | $305,000 | |
| Previous Owner | Rogers Hyon Suk | $295,260 |
Source: Public Records
Tax History Compared to Growth
Tax History
| Year | Tax Paid | Tax Assessment Tax Assessment Total Assessment is a certain percentage of the fair market value that is determined by local assessors to be the total taxable value of land and additions on the property. | Land | Improvement |
|---|---|---|---|---|
| 2025 | $3,529 | $59,900 | -- | -- |
| 2024 | $3,429 | $54,790 | $8,200 | $46,590 |
| 2023 | $3,429 | $54,790 | $8,200 | $46,590 |
| 2022 | $3,136 | $46,030 | $7,850 | $38,180 |
| 2021 | $3,312 | $47,350 | $8,070 | $39,280 |
| 2020 | $3,026 | $42,170 | $7,210 | $34,960 |
| 2019 | $2,992 | $42,170 | $7,210 | $34,960 |
| 2018 | $2,795 | $38,670 | $6,480 | $32,190 |
| 2017 | $2,784 | $38,670 | $6,480 | $32,190 |
| 2016 | $2,786 | $39,740 | $7,320 | $32,420 |
| 2015 | $2,780 | $39,740 | $7,320 | $32,420 |
| 2014 | $2,625 | $37,490 | $7,320 | $30,170 |
Source: Public Records
Map
Nearby Homes
- 4625 Broadmoor Bluffs Dr
- 760 Herbglen Ct
- 830 Lilacglen Ct
- 4884 Sanctuary Grove
- 485 Cardiff Cir
- 4446 Spiceglen Dr
- 4529 Songglen Cir
- 4815 Broadmoor Bluffs Dr
- 6478 Farthing Dr
- 4125 Danceglen Dr
- 4230 Danceglen Dr
- 750 Capeglen Rd
- 6358 Farthing Dr
- 381 San Marino Ct
- 5211 Bancroft Heights
- 5485 Backglen Dr
- 5015 Broadmoor Bluffs Dr
- 570 Brandywine Dr
- 195 Odessa Place
- lot 598 Beckwith Dr Unit 4723401180
- 725 Herbglen Ct
- 705 Herbglen Ct
- 710 Yardglen Ct
- 735 Herbglen Ct
- 720 Yardglen Ct
- 4925 Briscoglen Dr
- 720 Herbglen Ct
- 745 Herbglen Ct
- 730 Herbglen Ct
- 710 Herbglen Ct
- 740 Herbglen Ct
- 755 Herbglen Ct
- 730 Yardglen Ct
- 750 Herbglen Ct
- 5008 Briscoglen Dr
- 5950 Farthing Dr
- 4635 Broadmoor Bluffs Dr
- 5960 Farthing Dr
- 5016 Briscoglen Dr
- 5940 Farthing Dr