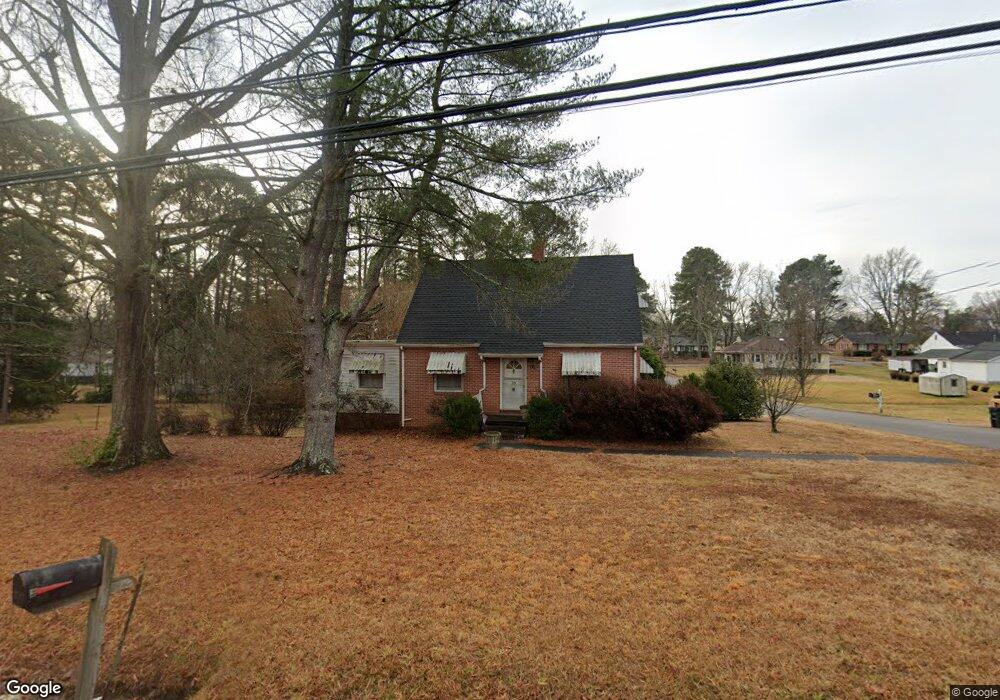
715 Hillsboro St Oxford, NC 27565
Estimated Value: $275,604 - $303,000
4
Beds
2
Baths
1,681
Sq Ft
$171/Sq Ft
Est. Value
About This Home
This home is located at 715 Hillsboro St, Oxford, NC 27565 and is currently estimated at $287,651, approximately $171 per square foot. 715 Hillsboro St is a home located in Granville County with nearby schools including West Oxford Elementary School, Northern Granville Middle School, and J.F. Webb High School.
Ownership History
Date
Name
Owned For
Owner Type
Purchase Details
Closed on
Jul 14, 2025
Sold by
Moreno Kevin Thomas
Bought by
Gonzalez Estain Elias Velasq
Current Estimated Value
Home Financials for this Owner
Home Financials are based on the most recent Mortgage that was taken out on this home.
Original Mortgage
$265,410
Outstanding Balance
$264,369
Interest Rate
6.85%
Mortgage Type
New Conventional
Estimated Equity
$23,282
Purchase Details
Closed on
Apr 26, 2023
Sold by
Koons Donal G and Koons Edith G
Bought by
Moreno Kevin Thomas
Purchase Details
Closed on
Nov 16, 2009
Sold by
Harrell Howard V and Harrell Dara E
Bought by
Koons Donal G and Koons Edith G
Create a Home Valuation Report for This Property
The Home Valuation Report is an in-depth analysis detailing your home's value as well as a comparison with similar homes in the area
Home Values in the Area
Average Home Value in this Area
Purchase History
| Date | Buyer | Sale Price | Title Company |
|---|---|---|---|
| Gonzalez Estain Elias Velasq | $295,000 | None Listed On Document | |
| Velasq Gonzalez Estain Elias | $295,000 | None Listed On Document | |
| Moreno Kevin Thomas | $7,000 | None Listed On Document | |
| Moreno Kevin Thomas | $7,000 | None Listed On Document | |
| Koons Donal G | $13,500 | -- |
Source: Public Records
Mortgage History
| Date | Status | Borrower | Loan Amount |
|---|---|---|---|
| Open | Velasq Gonzalez Estain Elias | $265,410 | |
| Closed | Velasq Gonzalez Estain Elias | $265,410 |
Source: Public Records
Tax History Compared to Growth
Tax History
| Year | Tax Paid | Tax Assessment Tax Assessment Total Assessment is a certain percentage of the fair market value that is determined by local assessors to be the total taxable value of land and additions on the property. | Land | Improvement |
|---|---|---|---|---|
| 2025 | $1,123 | $89,303 | $8,100 | $81,203 |
| 2024 | $1,123 | $18,897 | $8,100 | $10,797 |
| 2023 | $307 | $12,582 | $7,560 | $5,022 |
| 2022 | $236 | $12,582 | $7,560 | $5,022 |
| 2021 | $226 | $12,582 | $7,560 | $5,022 |
| 2020 | $226 | $12,582 | $7,560 | $5,022 |
| 2019 | $226 | $12,582 | $7,560 | $5,022 |
| 2018 | $226 | $12,582 | $7,560 | $5,022 |
| 2016 | $446 | $26,720 | $7,560 | $19,160 |
| 2015 | $423 | $26,720 | $7,560 | $19,160 |
| 2014 | $423 | $26,720 | $7,560 | $19,160 |
| 2013 | -- | $26,720 | $7,560 | $19,160 |
Source: Public Records
Map
Nearby Homes
- 105 W Thorndale Dr
- 201 Providence Rd
- 104 Seaman St
- 111 Ward Ave
- 96 North St
- 43 Church St
- 0 Church St
- 300 Coleman St
- 212 Orange St
- 210 Orange St
- 204 Cardinal Ct
- 206 Cardinal Ct
- 405 Sycamore St
- 220 Maple Dr Unit A & B
- 206 1st St
- 9037 N Carolina 96
- 112 1st St
- 230 Maple Dr Unit 232
- 609 N Country Club Dr
- 316 Keeneland Dr
- 715 Thorndale Dr
- 801 Hillsboro St
- 716 Hillsboro St
- 803 Hillsboro St
- 200 W Thorndale Dr
- 714 Hillsboro St
- 200 S Country Club Dr
- 110 W Thorndale Dr
- 110 W Thorndale Dr
- 800 Hillsboro St
- 711 Hillsboro St
- 202 W Thorndale Dr
- 805 Hillsboro St
- 108 W Thorndale Dr
- 710 Hillsboro St
- 802 Hillsboro St
- 204 W Thorndale Dr
- 707 Hillsboro St
- 204 W Thorndale Dr
- 106 W Thorndale Dr