Estimated Value: $304,158 - $325,000
3
Beds
2
Baths
1,400
Sq Ft
$224/Sq Ft
Est. Value
About This Home
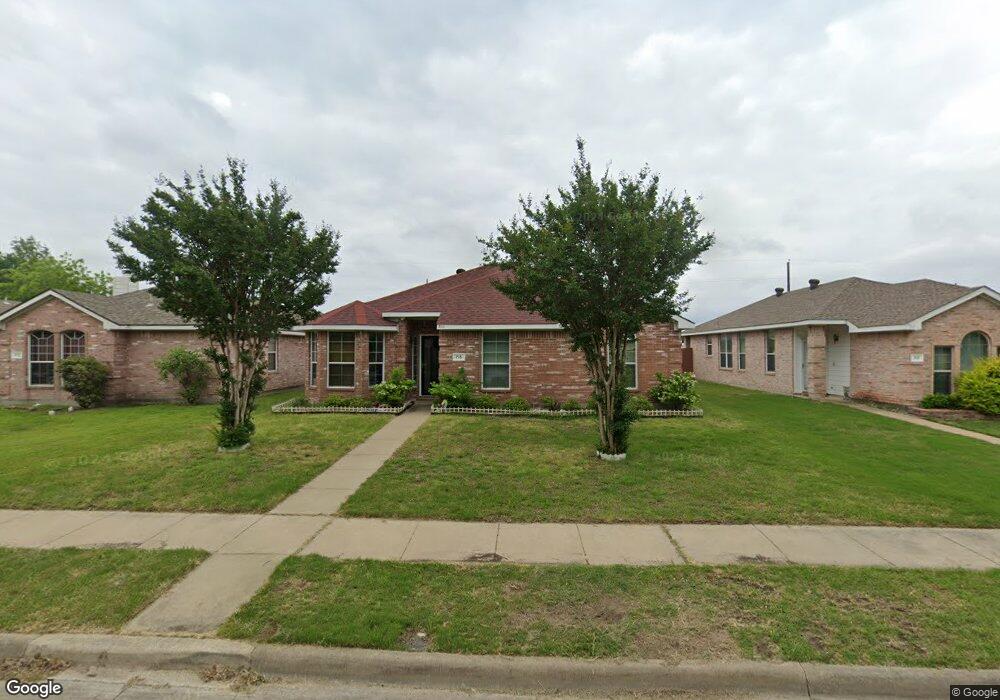
This home is located at 715 Kerwin Ct, Wylie, TX 75098 and is currently estimated at $314,290, approximately $224 per square foot. 715 Kerwin Ct is a home located in Collin County with nearby schools including T.F. Birmingham Elementary School, Frank Mcmillan Junior High School, and Davis Intermediate School.
Ownership History
Date
Name
Owned For
Owner Type
Purchase Details
Closed on
Apr 19, 2011
Sold by
The Secretary Of Housing & Urban Develop
Bought by
Mohammed Din and Ashraf Mushfeca
Current Estimated Value
Home Financials for this Owner
Home Financials are based on the most recent Mortgage that was taken out on this home.
Original Mortgage
$93,498
Outstanding Balance
$64,354
Interest Rate
4.75%
Mortgage Type
FHA
Estimated Equity
$249,936
Purchase Details
Closed on
Sep 7, 2010
Sold by
Baker Paula and Baker Steven
Bought by
James B Nutter & Company
Purchase Details
Closed on
Jun 24, 2004
Sold by
Choice Homes Inc
Bought by
Baker Steven and Baker Paula
Home Financials for this Owner
Home Financials are based on the most recent Mortgage that was taken out on this home.
Original Mortgage
$128,900
Interest Rate
6.3%
Mortgage Type
FHA
Create a Home Valuation Report for This Property
The Home Valuation Report is an in-depth analysis detailing your home's value as well as a comparison with similar homes in the area
Home Values in the Area
Average Home Value in this Area
Purchase History
| Date | Buyer | Sale Price | Title Company |
|---|---|---|---|
| Mohammed Din | -- | None Available | |
| James B Nutter & Company | $129,435 | None Available | |
| Baker Steven | -- | -- |
Source: Public Records
Mortgage History
| Date | Status | Borrower | Loan Amount |
|---|---|---|---|
| Open | Mohammed Din | $93,498 | |
| Previous Owner | Baker Steven | $128,900 |
Source: Public Records
Tax History Compared to Growth
Tax History
| Year | Tax Paid | Tax Assessment Tax Assessment Total Assessment is a certain percentage of the fair market value that is determined by local assessors to be the total taxable value of land and additions on the property. | Land | Improvement |
|---|---|---|---|---|
| 2025 | $4,545 | $283,262 | $76,500 | $206,762 |
| 2024 | $4,545 | $295,206 | $80,750 | $237,881 |
| 2023 | $4,545 | $268,369 | $71,250 | $239,857 |
| 2022 | $5,352 | $243,972 | $71,250 | $224,237 |
| 2021 | $5,218 | $226,735 | $57,000 | $169,735 |
| 2020 | $5,007 | $201,929 | $47,500 | $154,429 |
| 2019 | $4,817 | $183,300 | $47,500 | $154,512 |
| 2018 | $4,488 | $166,636 | $38,000 | $151,790 |
| 2017 | $4,080 | $166,078 | $38,000 | $128,078 |
| 2016 | $3,826 | $146,172 | $33,250 | $112,922 |
| 2015 | $2,967 | $133,240 | $33,250 | $99,990 |
Source: Public Records
Map
Nearby Homes
- 315 Celia Cir
- 314 Stephanie St
- 310 Austin Ave
- 708 Andersonville Ln
- 918 Marble Creek Dr
- 115 Pullman Place
- 934 W Cedar Creek Dr
- 107 N Winding Oaks Dr
- 420 W Oak St
- 327 Crosscreek Dr
- 300 S Cottonbelt Ave Unit 3A
- 804 Memorial Dr
- 205 S Cottonbelt Ave
- 903 Mardi Gras Ln
- 404 W Jefferson St
- 913 Chickesaw Ln
- 111 N Keefer Dr
- Crest Plan at The Apollo
- Nova Plan at The Apollo
- Solis Plan at The Apollo