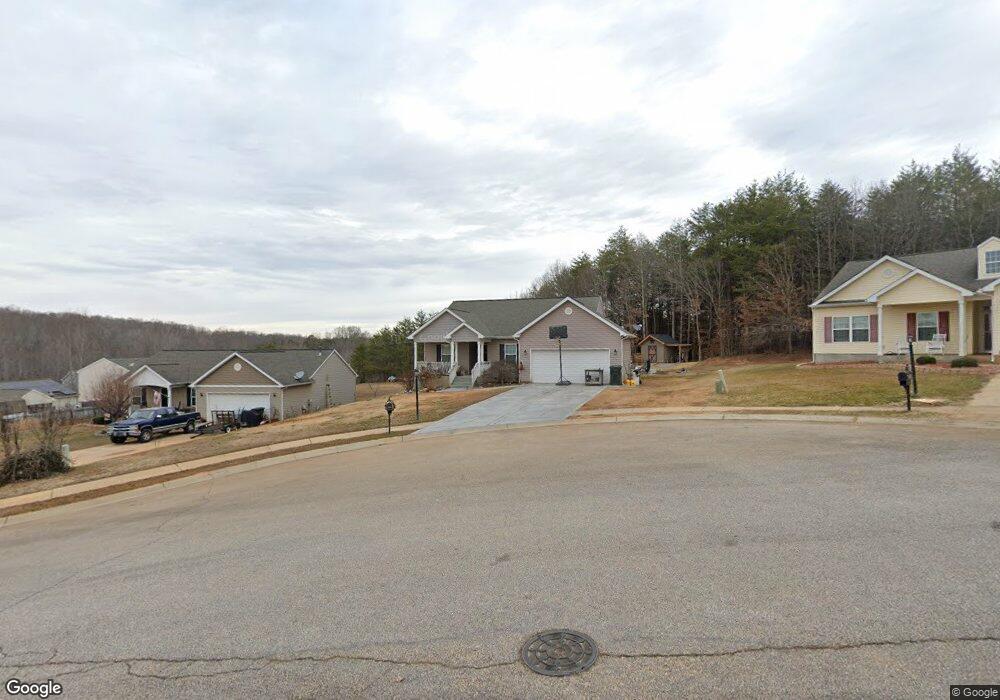
715 Lazy Oak Ct Clover, SC 29710
Estimated Value: $293,000 - $363,104
3
Beds
2
Baths
1,361
Sq Ft
$235/Sq Ft
Est. Value
About This Home
This home is located at 715 Lazy Oak Ct, Clover, SC 29710 and is currently estimated at $319,776, approximately $234 per square foot. 715 Lazy Oak Ct is a home located in York County with nearby schools including Kinard Elementary School, Clover Middle School, and Clover High School.
Ownership History
Date
Name
Owned For
Owner Type
Purchase Details
Closed on
May 11, 2010
Sold by
Nguyen Chau
Bought by
Musae Mark
Current Estimated Value
Home Financials for this Owner
Home Financials are based on the most recent Mortgage that was taken out on this home.
Original Mortgage
$130,099
Interest Rate
4.91%
Mortgage Type
FHA
Purchase Details
Closed on
May 7, 2010
Sold by
Ellis Homes Llc
Bought by
Musae Mark
Home Financials for this Owner
Home Financials are based on the most recent Mortgage that was taken out on this home.
Original Mortgage
$130,099
Interest Rate
4.91%
Mortgage Type
FHA
Purchase Details
Closed on
Mar 19, 2010
Sold by
Ellis Homes Llc
Bought by
Musae Mark and Nguyen Chau
Home Financials for this Owner
Home Financials are based on the most recent Mortgage that was taken out on this home.
Original Mortgage
$130,099
Interest Rate
4.91%
Mortgage Type
FHA
Purchase Details
Closed on
Dec 31, 2009
Sold by
Best Home Builders Llc
Bought by
Ellis Homes Llc
Create a Home Valuation Report for This Property
The Home Valuation Report is an in-depth analysis detailing your home's value as well as a comparison with similar homes in the area
Home Values in the Area
Average Home Value in this Area
Purchase History
| Date | Buyer | Sale Price | Title Company |
|---|---|---|---|
| Musae Mark | -- | -- | |
| Musae Mark | -- | -- | |
| Musae Mark | $132,500 | -- | |
| Ellis Homes Llc | -- | -- |
Source: Public Records
Mortgage History
| Date | Status | Borrower | Loan Amount |
|---|---|---|---|
| Previous Owner | Musae Mark | $130,099 |
Source: Public Records
Tax History Compared to Growth
Tax History
| Year | Tax Paid | Tax Assessment Tax Assessment Total Assessment is a certain percentage of the fair market value that is determined by local assessors to be the total taxable value of land and additions on the property. | Land | Improvement |
|---|---|---|---|---|
| 2025 | $1,947 | $7,830 | $1,098 | $6,732 |
| 2024 | $1,734 | $6,808 | $1,104 | $5,704 |
| 2023 | $1,724 | $6,808 | $1,104 | $5,704 |
| 2022 | $1,558 | $6,808 | $1,104 | $5,704 |
| 2021 | -- | $6,808 | $1,104 | $5,704 |
| 2020 | $1,499 | $6,808 | $0 | $0 |
| 2019 | $1,395 | $5,920 | $0 | $0 |
| 2018 | $1,382 | $5,920 | $0 | $0 |
| 2017 | $1,308 | $5,920 | $0 | $0 |
| 2016 | $1,296 | $5,920 | $0 | $0 |
| 2014 | $1,233 | $5,920 | $1,040 | $4,880 |
| 2013 | $1,233 | $5,740 | $1,040 | $4,700 |
Source: Public Records
Map
Nearby Homes
- 395 Lone Tree Ln
- 534 Pennyfields Ln
- 229 Price St
- 132 Oak St
- 111 Sunset Dr
- 206 Frances St
- 202 Alexander St
- 909 S Main St
- 7+/- Acres Forest St
- 208 Forest St
- 206 Mcconnell St
- 210 Smith St
- 312 Flat Rock St
- 156 Triple Ponds Ct
- 101 Ridge Ave
- Pinehurst with 3rd Floor Retreat Plan at Edmunds Farm
- Madison Plan at Edmunds Farm
- Southport Plan at Edmunds Farm
- Beverly Plan at Edmunds Farm
- St. Andrews Plan at Edmunds Farm
- 711 Lazy Oak Ct
- 719 Lazy Oak Ct
- 723 Lazy Oak Ct
- 510 Pennyfields Ln
- 375 Lone Tree Ln
- 514 Pennyfields Ln
- 367 Lone Tree Ln
- 371 Lone Tree Ln
- 363 Lone Tree Ln
- 718 Lazy Oak Ct
- 706 Lazy Oak Ct
- 518 Pennyfields Ln
- 710 Lazy Oak Ct
- 714 Lazy Oak Ct
- 506 Pennyfields Ln
- 522 Pennyfields Ln
- 372 Lone Tree Ln
- 368 Lone Tree Ln
- 376 Lone Tree Ln
- 380 Lone Tree Ln