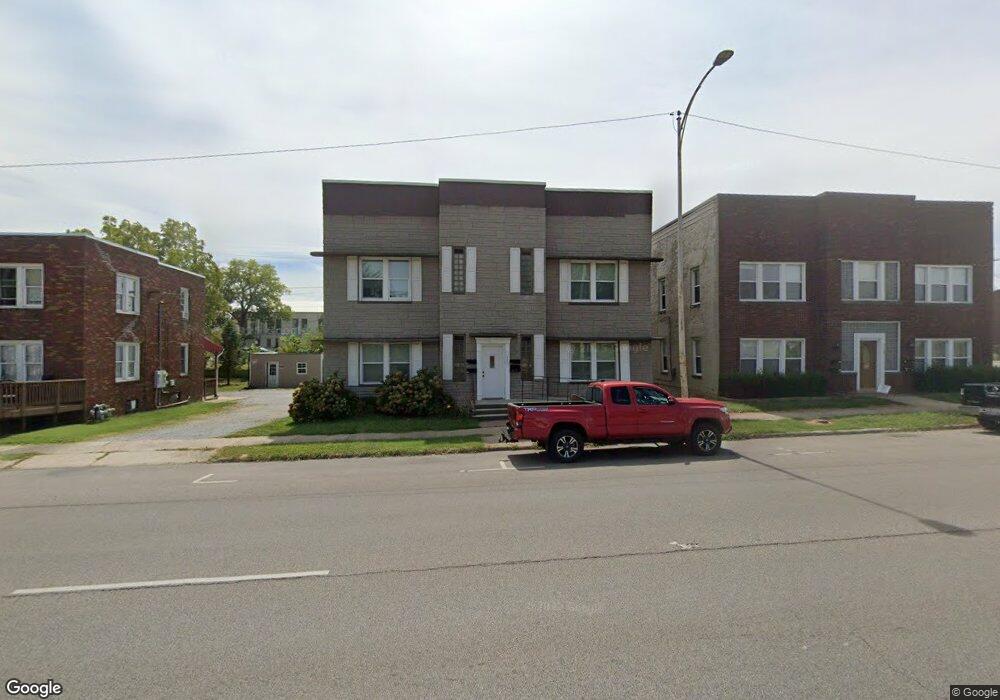
715 Main St Mount Vernon, IL 62864
Estimated Value: $110,000 - $302,563
Studio
--
Bath
--
Sq Ft
7,405
Sq Ft Lot
About This Home
This home is located at 715 Main St, Mount Vernon, IL 62864 and is currently estimated at $208,891. 715 Main St is a home located in Jefferson County with nearby schools including Osborne Primary Center, J.L. Buford Intermediate Education Center, and Zadok Casey Middle School.
Ownership History
Date
Name
Owned For
Owner Type
Purchase Details
Closed on
Feb 14, 2023
Sold by
Dent Barry S and Dent Kimberly G
Bought by
Salgado Boyz Properties Llc
Current Estimated Value
Home Financials for this Owner
Home Financials are based on the most recent Mortgage that was taken out on this home.
Original Mortgage
$253,221
Outstanding Balance
$245,276
Interest Rate
6.33%
Mortgage Type
New Conventional
Estimated Equity
-$36,385
Purchase Details
Closed on
Apr 27, 2016
Sold by
Clay City Banking Company
Bought by
Dent Barry S and Dent Kimberly G
Purchase Details
Closed on
Dec 30, 2011
Sold by
Jones Charles Edward
Bought by
Smith Stephen J
Home Financials for this Owner
Home Financials are based on the most recent Mortgage that was taken out on this home.
Original Mortgage
$97,750
Interest Rate
3.99%
Mortgage Type
Future Advance Clause Open End Mortgage
Create a Home Valuation Report for This Property
The Home Valuation Report is an in-depth analysis detailing your home's value as well as a comparison with similar homes in the area
Home Values in the Area
Average Home Value in this Area
Purchase History
| Date | Buyer | Sale Price | Title Company |
|---|---|---|---|
| Salgado Boyz Properties Llc | $255,000 | None Listed On Document | |
| Dent Barry S | $40,000 | None Available | |
| Smith Stephen J | $115,000 | None Available |
Source: Public Records
Mortgage History
| Date | Status | Borrower | Loan Amount |
|---|---|---|---|
| Open | Salgado Boyz Properties Llc | $253,221 | |
| Previous Owner | Smith Stephen J | $97,750 |
Source: Public Records
Tax History
| Year | Tax Paid | Tax Assessment Tax Assessment Total Assessment is a certain percentage of the fair market value that is determined by local assessors to be the total taxable value of land and additions on the property. | Land | Improvement |
|---|---|---|---|---|
| 2024 | $8,943 | $103,000 | $9,122 | $93,878 |
| 2023 | $8,320 | $95,088 | $8,421 | $86,667 |
| 2022 | $2,705 | $27,964 | $7,387 | $20,577 |
| 2021 | $2,589 | $26,632 | $7,035 | $19,597 |
| 2020 | $2,596 | $24,890 | $6,575 | $18,315 |
| 2019 | $2,561 | $24,890 | $6,575 | $18,315 |
| 2018 | $2,386 | $23,467 | $6,575 | $16,892 |
| 2017 | $2,335 | $23,467 | $6,575 | $16,892 |
| 2016 | $2,278 | $44,791 | $6,575 | $38,216 |
| 2015 | $4,254 | $44,791 | $6,575 | $38,216 |
| 2014 | $3,503 | $44,791 | $6,575 | $38,216 |
| 2013 | $3,503 | $42,256 | $6,203 | $36,053 |
Source: Public Records
Map
Nearby Homes
- 601 Broadway St
- 205 S 6th St
- 207 N 8th St
- 215 N 8th St
- 606 Harrison St
- 9485 Illinois 15
- 15752 N Il Hwy 37 Hwy N
- 1300 Tolle Ln
- 19840 N Il 37 Hwy
- 300 S 4th St
- 200 N 12th St Unit 206 N
- 331 N 4th St
- 14017 E Eastland Rd
- 1122 Maple St
- 313 Castleton Ave
- 1005 Pace Ave
- 213 S 2nd St
- 2223 Casey Ave
- 2501 Casey Ave
- 1917 Casey Ave
- 715 Main 0 St
- 715 Main St
- 718 Main St
- 704 Main St
- 712 Main St
- 800 Broadway St Unit 2
- 800 Broadway St Unit 3
- 800 Broadway St
- 800 Broadway St
- 800 Main St
- 805 Broadway St Unit Kitchenette
- 805 Broadway St Unit 1
- 805 Broadway St Unit 2
- 805 Broadway St Unit 6
- 805 Broadway St Unit 5
- 805 Broadway St Unit 4
- 805 Broadway St
- 824 Main St Unit A
- 824 Main St Unit B
- 826 Main St
Your Personal Tour Guide
Ask me questions while you tour the home.