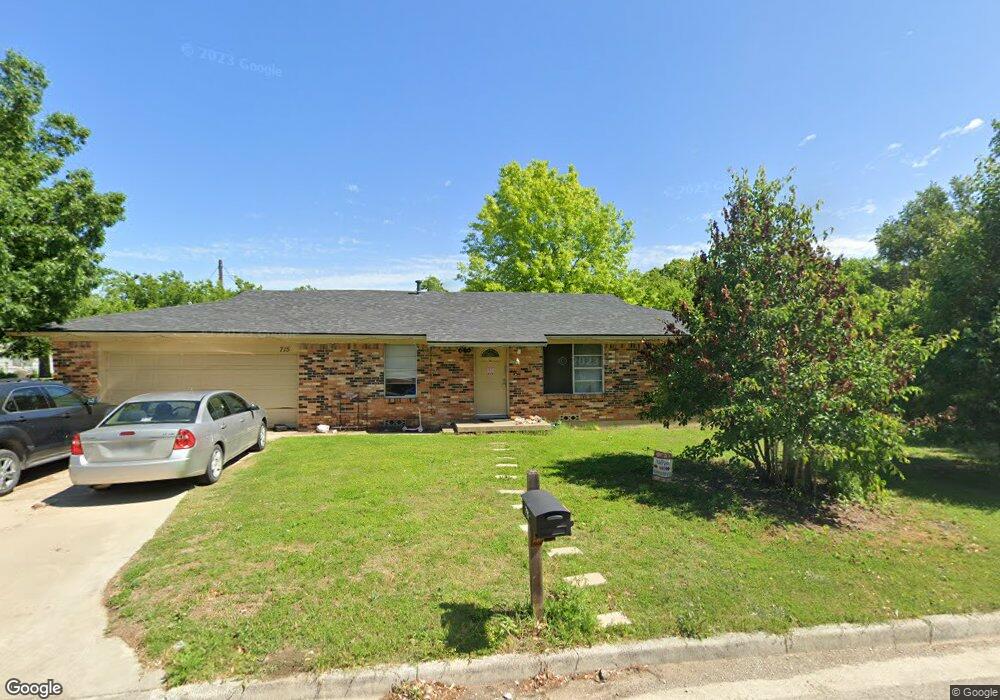
715 Marshall St Sanger, TX 76266
Estimated Value: $233,000 - $252,000
3
Beds
1
Bath
1,260
Sq Ft
$194/Sq Ft
Est. Value
About This Home
This home is located at 715 Marshall St, Sanger, TX 76266 and is currently estimated at $244,928, approximately $194 per square foot. 715 Marshall St is a home located in Denton County with nearby schools including Chisholm Trail Elementary School, Clear Creek Intermediate School, and Sanger Sixth Grade Campus.
Ownership History
Date
Name
Owned For
Owner Type
Purchase Details
Closed on
May 10, 2013
Sold by
Blakely Mary R
Bought by
Christie John Paul and Christie Lisa H
Current Estimated Value
Home Financials for this Owner
Home Financials are based on the most recent Mortgage that was taken out on this home.
Original Mortgage
$78,571
Outstanding Balance
$56,000
Interest Rate
3.61%
Mortgage Type
New Conventional
Estimated Equity
$188,928
Purchase Details
Closed on
Feb 5, 1998
Sold by
Blakely Ozell and Blakely Nell
Bought by
Blakely Charles Edward
Home Financials for this Owner
Home Financials are based on the most recent Mortgage that was taken out on this home.
Original Mortgage
$10,500
Interest Rate
6.98%
Purchase Details
Closed on
Jun 22, 1994
Sold by
Pyron Billy Gene
Bought by
Pyron Mary Ann
Create a Home Valuation Report for This Property
The Home Valuation Report is an in-depth analysis detailing your home's value as well as a comparison with similar homes in the area
Home Values in the Area
Average Home Value in this Area
Purchase History
| Date | Buyer | Sale Price | Title Company |
|---|---|---|---|
| Christie John Paul | -- | Integrity Title | |
| Blakely Charles Edward | -- | -- | |
| Pyron Mary Ann | -- | -- |
Source: Public Records
Mortgage History
| Date | Status | Borrower | Loan Amount |
|---|---|---|---|
| Open | Christie John Paul | $78,571 | |
| Previous Owner | Blakely Charles Edward | $10,500 |
Source: Public Records
Tax History
| Year | Tax Paid | Tax Assessment Tax Assessment Total Assessment is a certain percentage of the fair market value that is determined by local assessors to be the total taxable value of land and additions on the property. | Land | Improvement |
|---|---|---|---|---|
| 2025 | $2,848 | $217,764 | $72,056 | $165,150 |
| 2024 | $4,001 | $197,967 | $0 | $0 |
| 2023 | $2,490 | $179,970 | $56,044 | $172,121 |
| 2022 | $3,628 | $163,609 | $49,569 | $179,746 |
| 2021 | $3,126 | $216,721 | $40,556 | $176,165 |
| 2020 | $2,992 | $135,214 | $40,556 | $133,513 |
| 2019 | $2,799 | $122,922 | $40,556 | $137,074 |
| 2018 | $2,558 | $111,747 | $40,556 | $106,791 |
| 2017 | $2,337 | $101,588 | $40,556 | $95,213 |
| 2016 | $1,982 | $92,353 | $22,531 | $70,381 |
| 2015 | $1,894 | $83,957 | $22,531 | $61,426 |
| 2014 | $1,894 | $81,512 | $22,531 | $58,981 |
| 2013 | -- | $63,953 | $22,531 | $41,422 |
Source: Public Records
Map
Nearby Homes
Your Personal Tour Guide
Ask me questions while you tour the home.