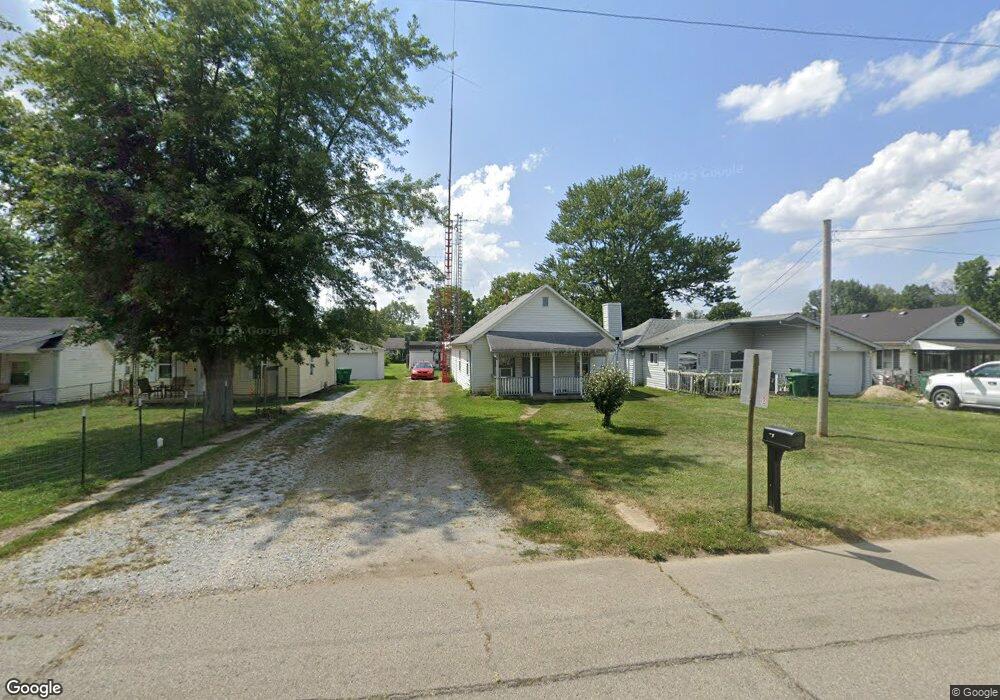
715 N 27th St New Castle, IN 47362
Estimated Value: $96,387 - $120,000
3
Beds
1
Bath
1,022
Sq Ft
$102/Sq Ft
Est. Value
About This Home
This home is located at 715 N 27th St, New Castle, IN 47362 and is currently estimated at $104,097, approximately $101 per square foot. 715 N 27th St is a home located in Henry County with nearby schools including Agape Learning Center.
Ownership History
Date
Name
Owned For
Owner Type
Purchase Details
Closed on
Feb 1, 2010
Sold by
Moran Juanita Mrie and Moran George O
Bought by
Moran George L
Current Estimated Value
Purchase Details
Closed on
Jan 5, 2005
Sold by
Moran George O and Moran Juanita Marie
Bought by
Moran George O and Moran Juanita Marie
Home Financials for this Owner
Home Financials are based on the most recent Mortgage that was taken out on this home.
Original Mortgage
$70,200
Interest Rate
6.75%
Mortgage Type
Adjustable Rate Mortgage/ARM
Create a Home Valuation Report for This Property
The Home Valuation Report is an in-depth analysis detailing your home's value as well as a comparison with similar homes in the area
Home Values in the Area
Average Home Value in this Area
Purchase History
| Date | Buyer | Sale Price | Title Company |
|---|---|---|---|
| Moran George L | -- | None Available | |
| Moran George O | -- | None Available |
Source: Public Records
Mortgage History
| Date | Status | Borrower | Loan Amount |
|---|---|---|---|
| Closed | Moran George O | $70,200 |
Source: Public Records
Tax History Compared to Growth
Tax History
| Year | Tax Paid | Tax Assessment Tax Assessment Total Assessment is a certain percentage of the fair market value that is determined by local assessors to be the total taxable value of land and additions on the property. | Land | Improvement |
|---|---|---|---|---|
| 2024 | -- | $41,700 | $7,000 | $34,700 |
| 2023 | -- | $39,500 | $7,000 | $32,500 |
| 2022 | $0 | $36,300 | $5,800 | $30,500 |
| 2021 | $0 | $36,100 | $5,800 | $30,300 |
| 2020 | $27 | $35,100 | $5,800 | $29,300 |
| 2019 | $28 | $35,900 | $5,800 | $30,100 |
| 2018 | $437 | $35,700 | $5,800 | $29,900 |
| 2017 | $409 | $35,200 | $5,800 | $29,400 |
| 2016 | $404 | $34,500 | $5,800 | $28,700 |
| 2014 | $339 | $33,400 | $5,800 | $27,600 |
| 2013 | $339 | $35,100 | $5,800 | $29,300 |
Source: Public Records
Map
Nearby Homes
- 2820 Brown St
- 2618 High St
- 288 N Hillsboro Rd
- 2518 Spring St
- 3108 E Brown Rd
- 000 N 28th St
- 2914 State St
- 420 N 20th St
- 222 N 21st St
- 2311 Alabama St
- 404 N 20th St
- 2406 Broad St
- 110 N 27th St
- 121 N 21st St
- 224 Reddingdale Dr
- 1707 Woodward Ave
- 218 S 21st St
- 2332 Highland Ave
- 512 N 16th St
- 1510 Michigan St