Estimated Value: $137,000 - $208,000
2
Beds
2
Baths
1,756
Sq Ft
$95/Sq Ft
Est. Value
About This Home
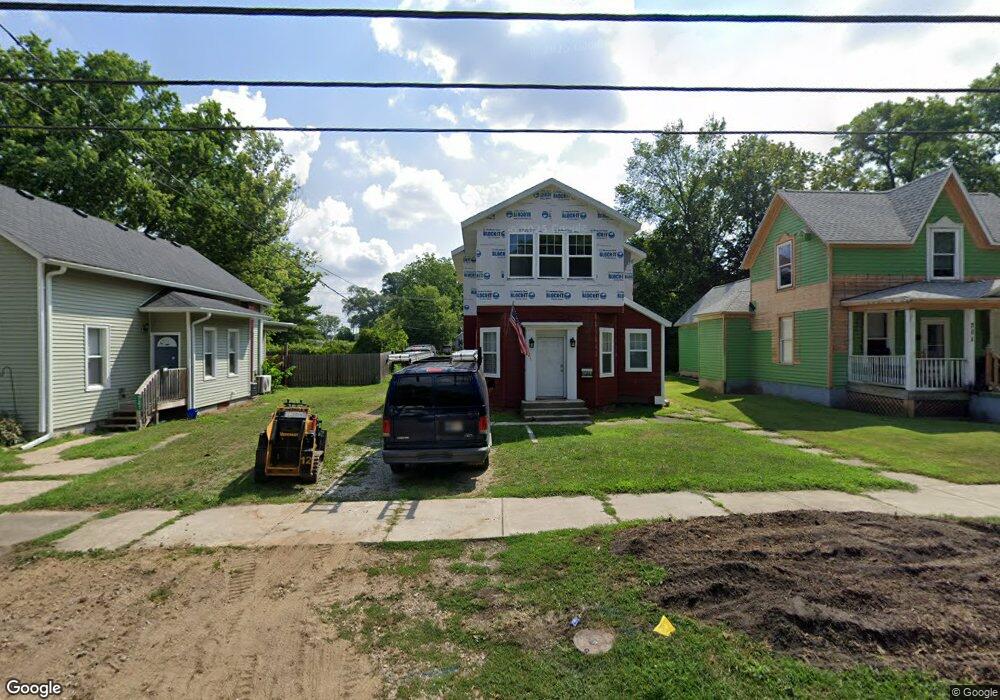
This home is located at 715 N 4th St, Niles, MI 49120 and is currently estimated at $166,614, approximately $94 per square foot. 715 N 4th St is a home located in Berrien County with nearby schools including Ballard Elementary School, Oak Manor Sixth Grade Center, and Ring Lardner Middle School.
Ownership History
Date
Name
Owned For
Owner Type
Purchase Details
Closed on
Jun 14, 2021
Sold by
Rogers Ronnie R
Bought by
Segety Rodney S
Current Estimated Value
Purchase Details
Closed on
Aug 7, 2020
Sold by
Rogers Ronnie R
Bought by
Segety Rodney
Purchase Details
Closed on
Dec 9, 2005
Sold by
Fannie Mae
Bought by
Rogers Ronnie R
Purchase Details
Closed on
Jul 29, 2004
Sold by
Mortgage Electronic Registration Systems
Bought by
Federal National Mortgage Association
Purchase Details
Closed on
Jul 22, 2004
Sold by
Osman Todd S
Bought by
Mortgage Electronic Registration Systems
Purchase Details
Closed on
Jun 8, 2001
Purchase Details
Closed on
Aug 12, 1993
Purchase Details
Closed on
Feb 24, 1992
Purchase Details
Closed on
Feb 21, 1992
Purchase Details
Closed on
Jul 2, 1987
Purchase Details
Closed on
May 29, 1987
Purchase Details
Closed on
Oct 21, 1983
Create a Home Valuation Report for This Property
The Home Valuation Report is an in-depth analysis detailing your home's value as well as a comparison with similar homes in the area
Home Values in the Area
Average Home Value in this Area
Purchase History
| Date | Buyer | Sale Price | Title Company |
|---|---|---|---|
| Segety Rodney S | -- | None Available | |
| Segety Rodney | -- | None Available | |
| Rogers Ronnie R | $15,500 | Meridian Title Corp | |
| Federal National Mortgage Association | -- | -- | |
| Mortgage Electronic Registration Systems | $45,660 | -- | |
| -- | $46,500 | -- | |
| -- | -- | -- | |
| -- | $36,000 | -- | |
| -- | $29,500 | -- | |
| -- | $29,500 | -- | |
| -- | $6,400 | -- | |
| -- | $6,400 | -- |
Source: Public Records
Mortgage History
| Date | Status | Borrower | Loan Amount |
|---|---|---|---|
| Closed | Segety Rodney | $0 |
Source: Public Records
Tax History Compared to Growth
Tax History
| Year | Tax Paid | Tax Assessment Tax Assessment Total Assessment is a certain percentage of the fair market value that is determined by local assessors to be the total taxable value of land and additions on the property. | Land | Improvement |
|---|---|---|---|---|
| 2025 | $1,273 | $59,900 | $0 | $0 |
| 2024 | $995 | $59,100 | $0 | $0 |
| 2023 | $954 | $41,800 | $0 | $0 |
| 2022 | $908 | $30,300 | $0 | $0 |
| 2021 | $965 | $27,700 | $2,000 | $25,700 |
| 2020 | $1,389 | $26,400 | $0 | $0 |
| 2019 | $1,370 | $24,400 | $1,400 | $23,000 |
| 2018 | $1,321 | $24,400 | $0 | $0 |
| 2017 | $1,307 | $28,400 | $0 | $0 |
| 2016 | $1,285 | $22,200 | $0 | $0 |
| 2015 | $1,405 | $28,100 | $0 | $0 |
| 2014 | $716 | $25,000 | $0 | $0 |
Source: Public Records
Map
Nearby Homes