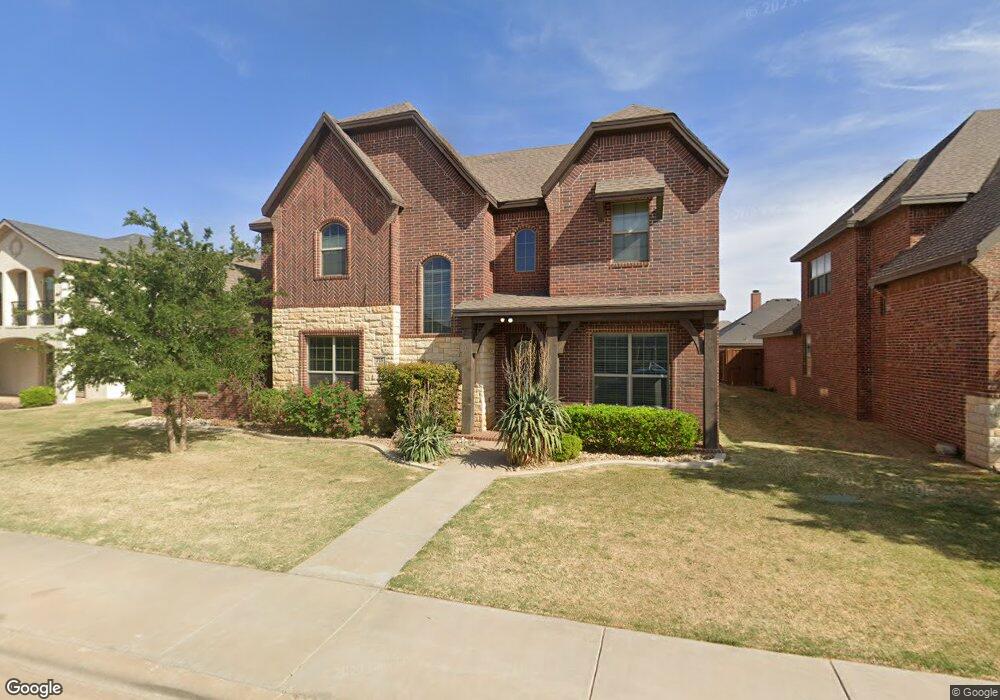
715 N 8th St Wolfforth, TX 79382
Estimated Value: $444,000 - $620,000
4
Beds
3
Baths
3,959
Sq Ft
$136/Sq Ft
Est. Value
About This Home
This home is located at 715 N 8th St, Wolfforth, TX 79382 and is currently estimated at $538,964, approximately $136 per square foot. 715 N 8th St is a home located in Lubbock County with nearby schools including Bennett Elementary School, Frenship Middle School, and Frenship High School.
Ownership History
Date
Name
Owned For
Owner Type
Purchase Details
Closed on
Oct 23, 2015
Sold by
Megatel Homes Ii Llc
Bought by
Nair Nandini and Chakkalath Hrishekesh R
Current Estimated Value
Purchase Details
Closed on
Feb 21, 2013
Sold by
Udf Pm Llc
Bought by
Megatel Homes Ii Llc
Home Financials for this Owner
Home Financials are based on the most recent Mortgage that was taken out on this home.
Original Mortgage
$330,650
Interest Rate
3.62%
Mortgage Type
Purchase Money Mortgage
Purchase Details
Closed on
Sep 4, 2007
Sold by
Llano Development Co
Bought by
Nair Nandini and Chakkalath Hrishekesh R
Create a Home Valuation Report for This Property
The Home Valuation Report is an in-depth analysis detailing your home's value as well as a comparison with similar homes in the area
Home Values in the Area
Average Home Value in this Area
Purchase History
| Date | Buyer | Sale Price | Title Company |
|---|---|---|---|
| Nair Nandini | -- | -- | |
| Megatel Homes Ii Llc | -- | Chicago Title | |
| Nair Nandini | -- | -- |
Source: Public Records
Mortgage History
| Date | Status | Borrower | Loan Amount |
|---|---|---|---|
| Previous Owner | Megatel Homes Ii Llc | $330,650 |
Source: Public Records
Tax History Compared to Growth
Tax History
| Year | Tax Paid | Tax Assessment Tax Assessment Total Assessment is a certain percentage of the fair market value that is determined by local assessors to be the total taxable value of land and additions on the property. | Land | Improvement |
|---|---|---|---|---|
| 2025 | $15,873 | $583,912 | $69,500 | $514,412 |
| 2024 | $15,873 | $599,680 | $69,500 | $530,180 |
| 2023 | $14,216 | $606,037 | $36,000 | $570,037 |
| 2022 | $13,701 | $534,830 | $36,000 | $498,830 |
| 2021 | $12,917 | $489,548 | $36,000 | $453,548 |
| 2020 | $12,113 | $459,994 | $36,000 | $423,994 |
| 2019 | $12,604 | $464,458 | $36,000 | $428,458 |
| 2018 | $13,209 | $484,421 | $32,000 | $452,421 |
| 2017 | $12,344 | $449,682 | $32,000 | $417,682 |
| 2016 | $12,024 | $438,021 | $32,000 | $406,021 |
| 2015 | $11,810 | $422,905 | $32,000 | $390,905 |
| 2014 | $11,810 | $393,949 | $32,000 | $361,949 |
Source: Public Records
Map
Nearby Homes