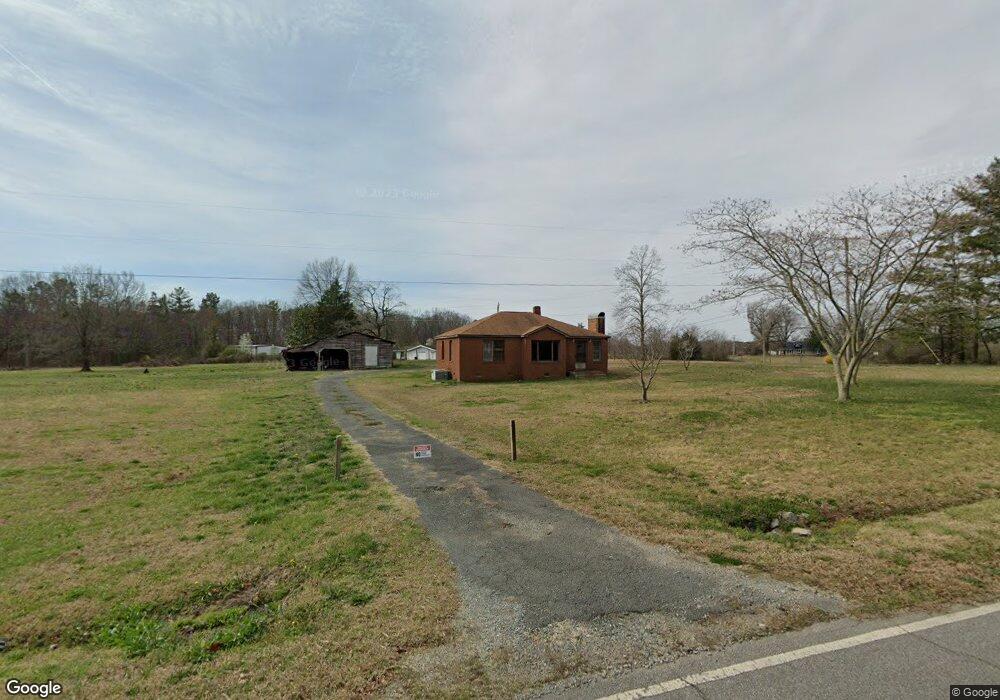
715 Pennigar Rd Monroe, NC 28110
Estimated Value: $350,000 - $463,000
3
Beds
1
Bath
1,569
Sq Ft
$244/Sq Ft
Est. Value
About This Home
This home is located at 715 Pennigar Rd, Monroe, NC 28110 and is currently estimated at $382,617, approximately $243 per square foot. 715 Pennigar Rd is a home located in Union County with nearby schools including Unionville Elementary School, Piedmont Middle School, and Piedmont High School.
Ownership History
Date
Name
Owned For
Owner Type
Purchase Details
Closed on
Oct 2, 2020
Sold by
Salek Gary Vincent and Salek Jennifer Dermid
Bought by
Salek Gary Vincent and Salek Jennifer Dermid
Current Estimated Value
Home Financials for this Owner
Home Financials are based on the most recent Mortgage that was taken out on this home.
Original Mortgage
$180,500
Outstanding Balance
$159,453
Interest Rate
2.9%
Mortgage Type
New Conventional
Estimated Equity
$223,164
Purchase Details
Closed on
Aug 29, 2001
Sold by
Howard Georgia W
Bought by
Quinn James T and Quinn Betty P
Home Financials for this Owner
Home Financials are based on the most recent Mortgage that was taken out on this home.
Original Mortgage
$153,000
Interest Rate
6.5%
Mortgage Type
VA
Create a Home Valuation Report for This Property
The Home Valuation Report is an in-depth analysis detailing your home's value as well as a comparison with similar homes in the area
Home Values in the Area
Average Home Value in this Area
Purchase History
| Date | Buyer | Sale Price | Title Company |
|---|---|---|---|
| Salek Gary Vincent | -- | None Available | |
| Salek Gary Vincent | $190,000 | None Available | |
| Quinn James T | $155,000 | -- |
Source: Public Records
Mortgage History
| Date | Status | Borrower | Loan Amount |
|---|---|---|---|
| Open | Salek Gary Vincent | $180,500 | |
| Previous Owner | Quinn James T | $153,000 |
Source: Public Records
Tax History
| Year | Tax Paid | Tax Assessment Tax Assessment Total Assessment is a certain percentage of the fair market value that is determined by local assessors to be the total taxable value of land and additions on the property. | Land | Improvement |
|---|---|---|---|---|
| 2025 | $1,628 | $320,400 | $0 | $0 |
| 2024 | $1,463 | $216,500 | $75,800 | $140,700 |
| 2023 | $1,449 | $216,500 | $75,800 | $140,700 |
| 2022 | $1,449 | $216,500 | $75,800 | $140,700 |
| 2021 | $1,450 | $216,500 | $75,800 | $140,700 |
| 2020 | $1,242 | $160,070 | $65,170 | $94,900 |
| 2019 | $929 | $160,070 | $65,170 | $94,900 |
| 2018 | $884 | $156,970 | $65,170 | $91,800 |
| 2017 | $937 | $157,000 | $65,200 | $91,800 |
| 2016 | $922 | $156,970 | $65,170 | $91,800 |
| 2015 | $933 | $156,970 | $65,170 | $91,800 |
| 2014 | $991 | $186,840 | $107,790 | $79,050 |
Source: Public Records
Map
Nearby Homes
- 5018 Duncan Rd
- 4933 Campobello Dr
- 835 W Unionville Indian Trail Rd
- 831 W Unionville Indian Trail Rd
- 4357 Hornyak Dr
- 1521 Hobart St
- 4223 Allenby Place
- 0 Unionville Indian Trail Rd W
- 4306 Allenby Place
- 1114 Unionville Indian Trail St Unit 2
- 1110 Unionville Indian Trail St Unit 3
- 4435 Allenby Place
- 1444 Harleston St
- 1354 Harleston St
- 600 Ivah Lee Way
- 1854 Carrollton Dr
- 122 E Cj Thomas Rd
- 1733 Tabby Dr Unit CAL0065
- 1701 Tabby Dr Unit CAL0057
- 4436 Roundwood Ct Unit 48
- 803 Pennigar Rd
- 716 Pennigar Rd
- 4914 Duncan Rd
- 4921 Duncan Rd
- 5006 Duncan Rd
- 617 Pennigar Rd
- 5010 Duncan Rd
- 618 Pennigar Rd
- 4903 Duncan Rd
- 5015 Duncan Rd
- 5015 Duncan Rd
- 5019 Duncan Rd
- 5022 Duncan Rd
- 612 Pennigar Rd
- 2106 Bernard Simpson Rd
- 708 Pennigar Rd
- 606 Pennigar Rd
- 5100 Duncan Rd
- 5103 Duncan Rd
- 2107 Bernard Simpson Rd
Your Personal Tour Guide
Ask me questions while you tour the home.