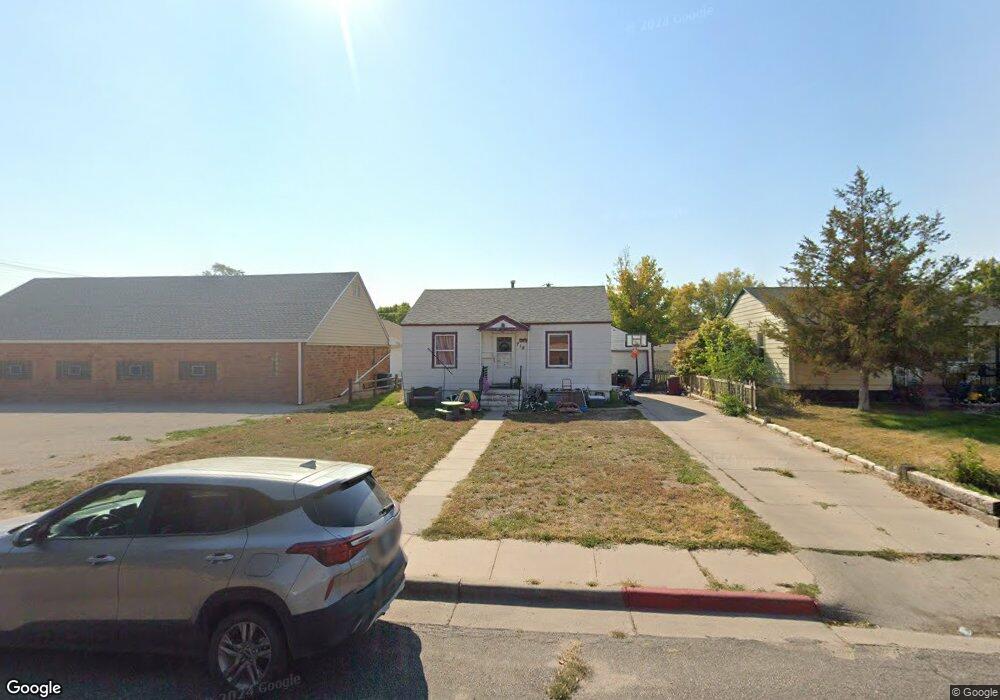
715 Q St Gering, NE 69341
Estimated Value: $133,000 - $165,000
3
Beds
2
Baths
672
Sq Ft
$217/Sq Ft
Est. Value
About This Home
This home is located at 715 Q St, Gering, NE 69341 and is currently estimated at $146,091, approximately $217 per square foot. 715 Q St is a home located in Scotts Bluff County with nearby schools including Gering High School and Community Christian Elementary/Middle School.
Ownership History
Date
Name
Owned For
Owner Type
Purchase Details
Closed on
May 29, 2020
Sold by
Larson John E and Larson Sherry S
Bought by
Larson John E and Larson Sherry S
Current Estimated Value
Purchase Details
Closed on
Feb 10, 2017
Sold by
Krug Don and Krug Donald A
Bought by
Larson John E and Larson Sherry S
Purchase Details
Closed on
Dec 13, 2007
Sold by
Felkins Investments Llc
Bought by
Schanhols Janelle Ann
Home Financials for this Owner
Home Financials are based on the most recent Mortgage that was taken out on this home.
Original Mortgage
$1,275
Interest Rate
6.27%
Mortgage Type
Purchase Money Mortgage
Purchase Details
Closed on
Dec 1, 2005
Sold by
Chavez Lauro V and Chavez Christina G
Bought by
Felkins Investments Llc
Home Financials for this Owner
Home Financials are based on the most recent Mortgage that was taken out on this home.
Original Mortgage
$48,221
Interest Rate
8.5%
Mortgage Type
Future Advance Clause Open End Mortgage
Create a Home Valuation Report for This Property
The Home Valuation Report is an in-depth analysis detailing your home's value as well as a comparison with similar homes in the area
Home Values in the Area
Average Home Value in this Area
Purchase History
| Date | Buyer | Sale Price | Title Company |
|---|---|---|---|
| Larson John E | -- | None Available | |
| Larson John E | $71,444 | Western Prairie Title | |
| Schanhols Janelle Ann | $72,000 | -- | |
| Felkins Investments Llc | $32,000 | -- |
Source: Public Records
Mortgage History
| Date | Status | Borrower | Loan Amount |
|---|---|---|---|
| Previous Owner | Schanhols Janelle Ann | $1,275 | |
| Previous Owner | Felkins Investments Llc | $48,221 |
Source: Public Records
Tax History Compared to Growth
Tax History
| Year | Tax Paid | Tax Assessment Tax Assessment Total Assessment is a certain percentage of the fair market value that is determined by local assessors to be the total taxable value of land and additions on the property. | Land | Improvement |
|---|---|---|---|---|
| 2024 | $2,058 | $117,165 | $17,500 | $99,665 |
| 2023 | $1,826 | $85,196 | $4,200 | $80,996 |
| 2022 | $1,826 | $85,196 | $4,200 | $80,996 |
| 2021 | $1,731 | $79,897 | $4,200 | $75,697 |
| 2020 | $1,663 | $76,292 | $4,200 | $72,092 |
| 2019 | $1,622 | $76,292 | $4,200 | $72,092 |
| 2018 | $1,632 | $76,292 | $4,200 | $72,092 |
| 2017 | $1,561 | $72,859 | $4,200 | $68,659 |
| 2016 | $1,449 | $72,859 | $4,200 | $68,659 |
| 2015 | $1,405 | $70,859 | $4,200 | $66,659 |
| 2014 | $1,425 | $70,859 | $4,200 | $66,659 |
| 2012 | -- | $69,552 | $4,200 | $65,352 |
Source: Public Records
Map
Nearby Homes