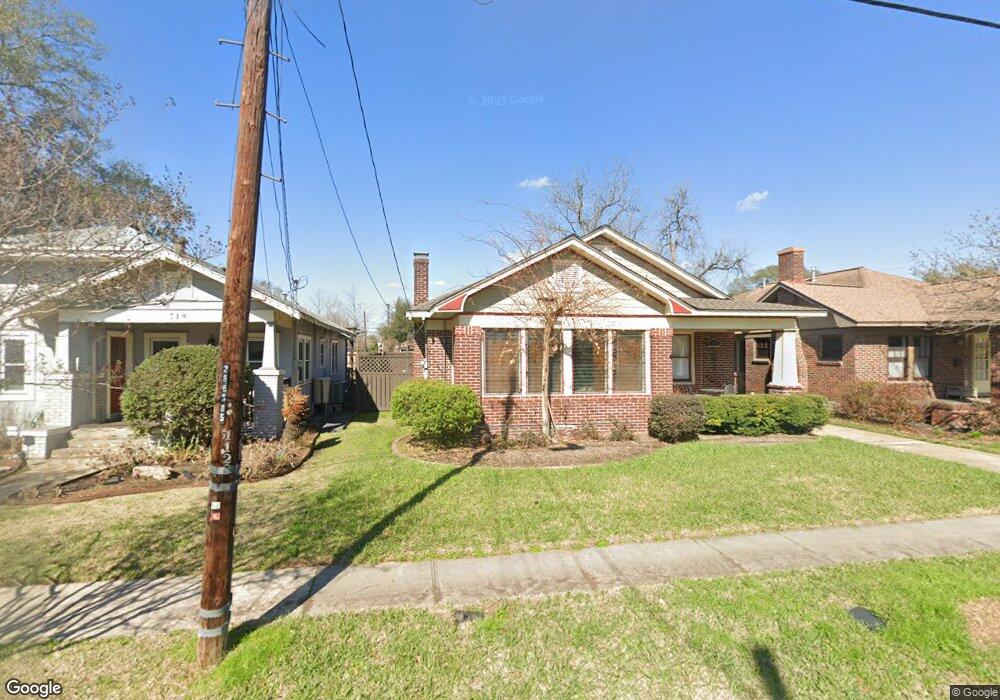
715 Redan St Houston, TX 77009
Greater Heights NeighborhoodEstimated Value: $655,000 - $848,000
4
Beds
2
Baths
2,079
Sq Ft
$368/Sq Ft
Est. Value
About This Home
This home is located at 715 Redan St, Houston, TX 77009 and is currently estimated at $765,465, approximately $368 per square foot. 715 Redan St is a home located in Harris County with nearby schools including Travis Elementary School, Hogg Middle, and Heights High School.
Ownership History
Date
Name
Owned For
Owner Type
Purchase Details
Closed on
Aug 28, 2015
Sold by
Simmons Brenda R and Erickson Brenda R
Bought by
Erickson Brenda R and Erickson John R
Current Estimated Value
Purchase Details
Closed on
May 15, 1995
Sold by
Stewart Reuben I and Stewart Kathryn A
Bought by
Simmons Brenda R
Home Financials for this Owner
Home Financials are based on the most recent Mortgage that was taken out on this home.
Original Mortgage
$93,200
Interest Rate
8.36%
Create a Home Valuation Report for This Property
The Home Valuation Report is an in-depth analysis detailing your home's value as well as a comparison with similar homes in the area
Home Values in the Area
Average Home Value in this Area
Purchase History
| Date | Buyer | Sale Price | Title Company |
|---|---|---|---|
| Erickson Brenda R | -- | None Available | |
| Simmons Brenda R | -- | First American Title |
Source: Public Records
Mortgage History
| Date | Status | Borrower | Loan Amount |
|---|---|---|---|
| Previous Owner | Simmons Brenda R | $93,200 |
Source: Public Records
Tax History Compared to Growth
Tax History
| Year | Tax Paid | Tax Assessment Tax Assessment Total Assessment is a certain percentage of the fair market value that is determined by local assessors to be the total taxable value of land and additions on the property. | Land | Improvement |
|---|---|---|---|---|
| 2025 | $4,916 | $661,735 | $625,000 | $36,735 |
| 2024 | $4,916 | $674,514 | $625,000 | $49,514 |
| 2023 | $4,916 | $652,697 | $562,500 | $90,197 |
| 2022 | $13,006 | $590,660 | $518,750 | $71,910 |
| 2021 | $13,748 | $593,731 | $500,000 | $93,731 |
| 2020 | $12,986 | $536,294 | $500,000 | $36,294 |
| 2019 | $12,336 | $582,514 | $500,000 | $82,514 |
| 2018 | $6,363 | $443,194 | $400,000 | $43,194 |
| 2017 | $11,206 | $443,194 | $400,000 | $43,194 |
| 2016 | $10,965 | $450,000 | $360,000 | $90,000 |
| 2015 | -- | $466,239 | $337,500 | $128,739 |
| 2014 | -- | $411,684 | $303,750 | $107,934 |
Source: Public Records
Map
Nearby Homes