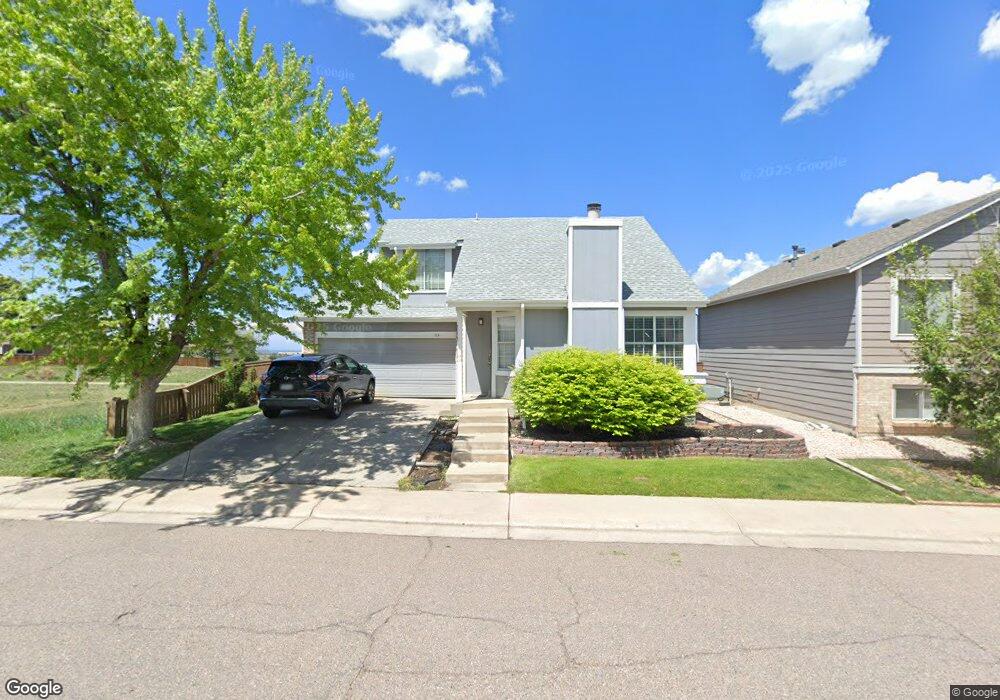
715 Ridgeglen Way Highlands Ranch, CO 80126
Northridge NeighborhoodEstimated Value: $510,000 - $550,000
2
Beds
2
Baths
1,070
Sq Ft
$494/Sq Ft
Est. Value
About This Home
This home is located at 715 Ridgeglen Way, Highlands Ranch, CO 80126 and is currently estimated at $528,205, approximately $493 per square foot. 715 Ridgeglen Way is a home located in Douglas County with nearby schools including Northridge Elementary School, Mountain Ridge Middle School, and Mountain Vista High School.
Ownership History
Date
Name
Owned For
Owner Type
Purchase Details
Closed on
Sep 20, 2000
Sold by
Thomasson Ronald A
Bought by
Filchak Ann M
Current Estimated Value
Home Financials for this Owner
Home Financials are based on the most recent Mortgage that was taken out on this home.
Original Mortgage
$189,731
Outstanding Balance
$68,709
Interest Rate
8.01%
Mortgage Type
FHA
Estimated Equity
$459,496
Purchase Details
Closed on
Nov 5, 1999
Sold by
Corieri Kelly M
Bought by
Thomasson Ronald A
Home Financials for this Owner
Home Financials are based on the most recent Mortgage that was taken out on this home.
Original Mortgage
$133,600
Interest Rate
7.73%
Mortgage Type
Balloon
Purchase Details
Closed on
Feb 27, 1992
Sold by
Mueller Gregory R
Bought by
Corieri Kelly M
Purchase Details
Closed on
Mar 5, 1985
Sold by
Mission Viejo Co
Bought by
Mueller Gregory R
Create a Home Valuation Report for This Property
The Home Valuation Report is an in-depth analysis detailing your home's value as well as a comparison with similar homes in the area
Home Values in the Area
Average Home Value in this Area
Purchase History
| Date | Buyer | Sale Price | Title Company |
|---|---|---|---|
| Filchak Ann M | $191,000 | Stewart Title | |
| Thomasson Ronald A | $167,000 | -- | |
| Corieri Kelly M | $97,000 | -- | |
| Mueller Gregory R | $93,100 | -- |
Source: Public Records
Mortgage History
| Date | Status | Borrower | Loan Amount |
|---|---|---|---|
| Open | Filchak Ann M | $189,731 | |
| Previous Owner | Thomasson Ronald A | $133,600 |
Source: Public Records
Tax History Compared to Growth
Tax History
| Year | Tax Paid | Tax Assessment Tax Assessment Total Assessment is a certain percentage of the fair market value that is determined by local assessors to be the total taxable value of land and additions on the property. | Land | Improvement |
|---|---|---|---|---|
| 2024 | $3,347 | $39,190 | $9,080 | $30,110 |
| 2023 | $3,341 | $39,190 | $9,080 | $30,110 |
| 2022 | $2,563 | $28,050 | $6,290 | $21,760 |
| 2021 | $2,666 | $28,050 | $6,290 | $21,760 |
| 2020 | $2,448 | $26,390 | $6,370 | $20,020 |
| 2019 | $2,457 | $26,390 | $6,370 | $20,020 |
| 2018 | $2,156 | $22,810 | $5,650 | $17,160 |
| 2017 | $1,963 | $22,810 | $5,650 | $17,160 |
| 2016 | $1,822 | $20,780 | $4,510 | $16,270 |
| 2015 | $1,861 | $20,780 | $4,510 | $16,270 |
| 2014 | $1,753 | $18,070 | $4,030 | $14,040 |
Source: Public Records
Map
Nearby Homes
- 9191 Hickory Cir
- 715 Myrtlewood Ct
- 772 Ivywood Ct
- 9171 Stargrass Cir
- 1146 Cherry Blossom Ct
- 818 Summer Dr Unit 7D
- 745 Stowe St
- 283 Saddlewood Cir
- 274 Saddlewood Cir
- 9050 Hunters Creek St
- 1495 Goldsmith Dr
- 154 Blue Spruce Ct
- 714 Old Stone Dr
- 145 Blue Spruce Ct
- 507 Fox Hunt Cir
- 1554 Sunset Ridge Rd
- 8822 Eagles Nest Ln
- 8975 S Coyote St
- 3 Burgundy Ct
- 1707 Sunset Ridge Rd
- 735 Ridgeglen Way
- 755 Ridgeglen Way
- 9184 Hickory Cir
- 775 Ridgeglen Way
- 9187 Butterwood Ct
- 673 Delwood Ct
- 795 Ridgeglen Way
- 683 Delwood Ct
- 9197 Butterwood Ct
- 663 Delwood Ct
- 9188 Butterwood Ct
- 9207 Butterwood Ct
- 693 Ridgeglen Way
- 9198 Butterwood Ct
- 9221 Butterwood Ct
- 9198 S Butterwood Ct
- 683 Ridgeglen Way
- 664 Delwood Ct
- 0 Hickory Cir
- 9208 Butterwood Ct