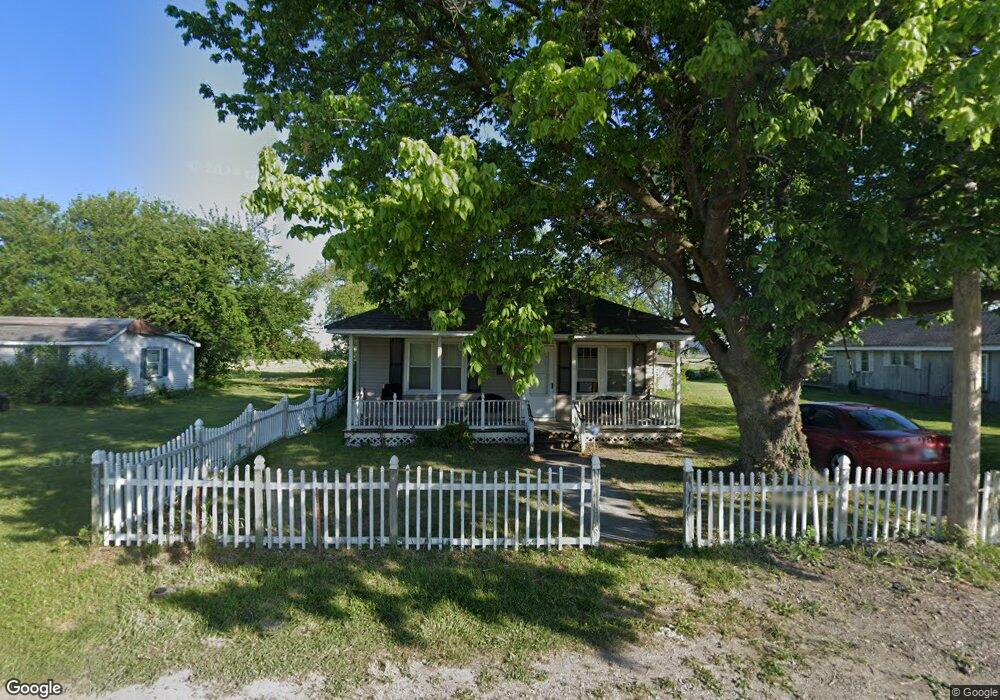
715 S 47th St East Saint Louis, IL 62207
Estimated Value: $29,000 - $94,000
--
Bed
--
Bath
1,024
Sq Ft
$56/Sq Ft
Est. Value
About This Home
This home is located at 715 S 47th St, East Saint Louis, IL 62207 and is currently estimated at $57,622, approximately $56 per square foot. 715 S 47th St is a home located in St. Clair County with nearby schools including Katie Harper-Wright Elementary School, Mason/Clark Middle School, and East St Louis Senior High School.
Ownership History
Date
Name
Owned For
Owner Type
Purchase Details
Closed on
Apr 8, 2015
Sold by
Palmer Skyla
Bought by
Palmer Eugene
Current Estimated Value
Purchase Details
Closed on
Mar 26, 2015
Sold by
Tujay Inc
Bought by
Palmer Skyla
Purchase Details
Closed on
Feb 12, 2015
Sold by
County Of St Clair
Bought by
Tujay Inc
Purchase Details
Closed on
Dec 31, 2014
Sold by
Jjp Inc
Bought by
Tujay Inc
Purchase Details
Closed on
Jun 12, 2010
Sold by
Coney James
Bought by
Jjp Inc
Create a Home Valuation Report for This Property
The Home Valuation Report is an in-depth analysis detailing your home's value as well as a comparison with similar homes in the area
Home Values in the Area
Average Home Value in this Area
Purchase History
| Date | Buyer | Sale Price | Title Company |
|---|---|---|---|
| Palmer Eugene | -- | None Available | |
| Palmer Skyla | $15,000 | None Available | |
| Tujay Inc | -- | None Available | |
| Tujay Inc | -- | None Available | |
| Jjp Inc | -- | None Available |
Source: Public Records
Tax History Compared to Growth
Tax History
| Year | Tax Paid | Tax Assessment Tax Assessment Total Assessment is a certain percentage of the fair market value that is determined by local assessors to be the total taxable value of land and additions on the property. | Land | Improvement |
|---|---|---|---|---|
| 2024 | $1,089 | $6,794 | $472 | $6,322 |
| 2023 | $1,010 | $6,141 | $427 | $5,714 |
| 2022 | $941 | $5,382 | $374 | $5,008 |
| 2021 | $1,612 | $8,757 | $354 | $8,403 |
| 2020 | $908 | $4,928 | $371 | $4,557 |
| 2019 | $937 | $4,928 | $371 | $4,557 |
| 2018 | $1,372 | $7,072 | $377 | $6,695 |
| 2017 | $780 | $8,302 | $367 | $7,935 |
| 2016 | $1,193 | $5,842 | $366 | $5,476 |
| 2014 | -- | $5,778 | $362 | $5,416 |
| 2013 | -- | $5,420 | $340 | $5,080 |
Source: Public Records
Map
Nearby Homes