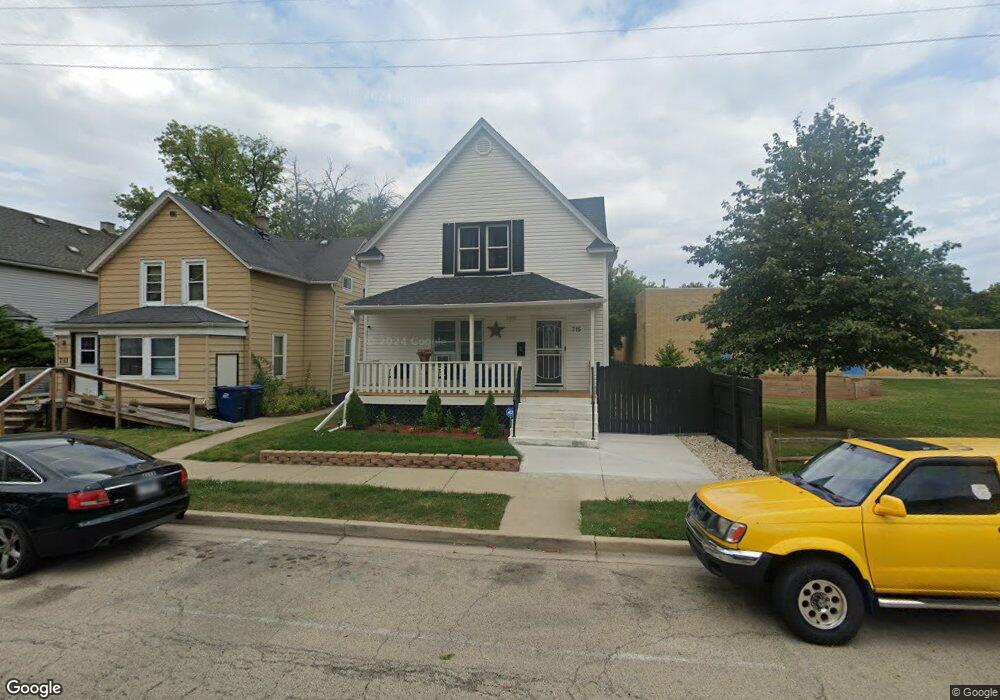
715 S Ml King jr Ave Waukegan, IL 60085
Estimated Value: $238,000 - $315,000
5
Beds
2
Baths
2,160
Sq Ft
$127/Sq Ft
Est. Value
About This Home
This home is located at 715 S Ml King jr Ave, Waukegan, IL 60085 and is currently estimated at $274,796, approximately $127 per square foot. 715 S Ml King jr Ave is a home located in Lake County with nearby schools including Carman-Buckner Elementary School, John R Lewis Middle School, and Waukegan High School.
Ownership History
Date
Name
Owned For
Owner Type
Purchase Details
Closed on
Apr 12, 2023
Sold by
Filipovic Mladen and Filipovic Claudia
Bought by
Acosta Jair and Acosta Edward Francisco
Current Estimated Value
Home Financials for this Owner
Home Financials are based on the most recent Mortgage that was taken out on this home.
Original Mortgage
$232,750
Outstanding Balance
$226,162
Interest Rate
6.5%
Mortgage Type
New Conventional
Estimated Equity
$48,634
Purchase Details
Closed on
Dec 18, 2012
Sold by
American Home Development
Bought by
Gilipovic Mladen and Martinez Alvarado Claudia
Purchase Details
Closed on
Dec 7, 2012
Sold by
Dorsey Artina and Barnes Sheonta
Bought by
American Home Development
Purchase Details
Closed on
Mar 8, 2007
Sold by
Belcher Esther and Mitchell Yvonne M
Bought by
Dorsey Charles Rudolph
Create a Home Valuation Report for This Property
The Home Valuation Report is an in-depth analysis detailing your home's value as well as a comparison with similar homes in the area
Home Values in the Area
Average Home Value in this Area
Purchase History
| Date | Buyer | Sale Price | Title Company |
|---|---|---|---|
| Acosta Jair | $245,000 | Chicago Title | |
| Gilipovic Mladen | $25,000 | First American Title | |
| American Home Development | $3,232 | None Available | |
| Dorsey Charles Rudolph | -- | None Available |
Source: Public Records
Mortgage History
| Date | Status | Borrower | Loan Amount |
|---|---|---|---|
| Open | Acosta Jair | $232,750 |
Source: Public Records
Tax History Compared to Growth
Tax History
| Year | Tax Paid | Tax Assessment Tax Assessment Total Assessment is a certain percentage of the fair market value that is determined by local assessors to be the total taxable value of land and additions on the property. | Land | Improvement |
|---|---|---|---|---|
| 2024 | $4,525 | $62,536 | $5,870 | $56,666 |
| 2023 | $3,320 | $55,989 | $5,255 | $50,734 |
| 2022 | $3,320 | $39,956 | $4,090 | $35,866 |
| 2021 | $2,946 | $34,257 | $3,562 | $30,695 |
| 2020 | $2,654 | $29,409 | $3,323 | $26,086 |
| 2019 | $2,618 | $26,949 | $3,045 | $23,904 |
| 2018 | $1,200 | $15,664 | $2,715 | $12,949 |
| 2017 | $1,118 | $13,858 | $2,402 | $11,456 |
| 2016 | $1,731 | $17,204 | $2,982 | $14,222 |
| 2015 | $1,588 | $15,398 | $2,669 | $12,729 |
| 2014 | $2,860 | $22,443 | $2,257 | $20,186 |
| 2012 | $3,137 | $24,315 | $2,445 | $21,870 |
Source: Public Records
Map
Nearby Homes
- 710 S Martin Luther King Junior Ave
- 515 May St
- 924 Lenox Ave
- 631 8th St
- 842 Wadsworth Ave
- 547 S Martin Luther King Junior Ave
- 815 Prescott St
- 600 Sunderlin St
- 724 10th St
- 1102 Wadsworth Ave
- 1101 Adams St
- 502 Belvidere Rd
- 408 Besley Place
- 305 Besley Place
- 1210 Park Ave
- 613 Clarke Ave
- 446 S Jackson St
- 720 13th St
- 215 S Park Ave
- 1244 Victoria Ave
- 715 S Martin Luther King jr Ave
- 711 S Ml King jr Ave
- 711 S Martin Luther King Junior Ave
- 709 S Ml King jr Ave
- 223 May St
- 221 May St
- 724 S Genesee St
- 714 S Ml King jr Ave
- 718 S Ml King jr Ave
- 718 S Martin Luther King jr Ave
- 710 S Ml King jr Ave
- 722 S Ml King jr Ave
- 706 S Martin Luther King jr Ave
- 706 S Ml King jr Ave
- 704 S Ml King jr Ave
- 726 S Ml King jr Ave
- 710 S Genesee St
- 730 S Ml King jr Ave
- 681 S Martin Luther King Junior Ave
- 309 May St