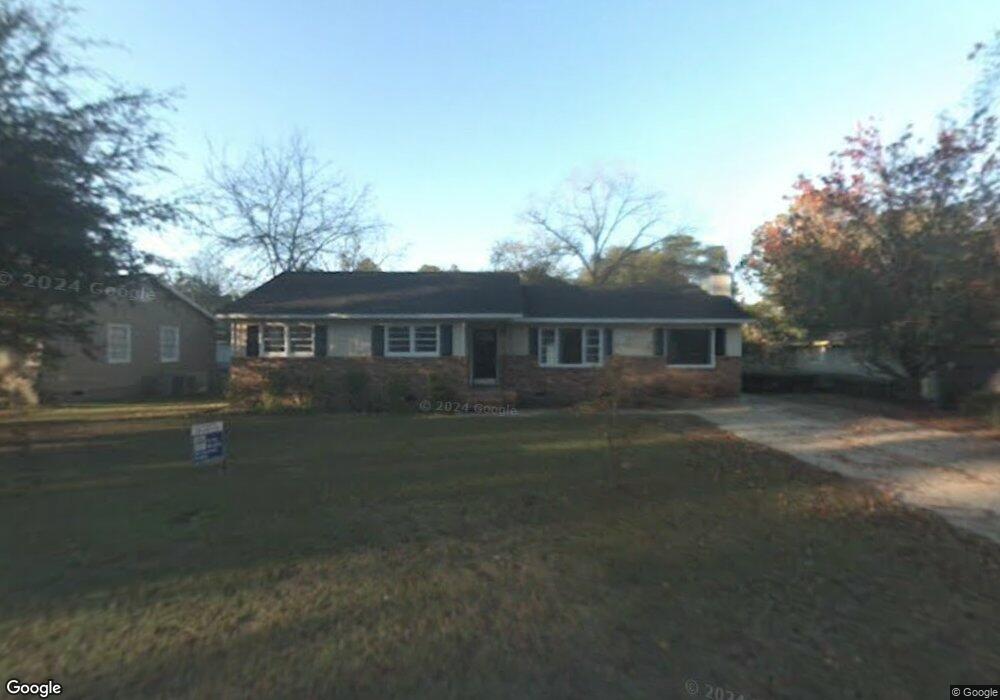
715 S Shadowlawn Dr Albany, GA 31707
Estimated Value: $99,000 - $131,000
3
Beds
2
Baths
1,470
Sq Ft
$78/Sq Ft
Est. Value
About This Home
This home is located at 715 S Shadowlawn Dr, Albany, GA 31707 and is currently estimated at $115,250, approximately $78 per square foot. 715 S Shadowlawn Dr is a home located in Dougherty County with nearby schools including West Town Elementary School, Southside Middle School, and Monroe High School.
Ownership History
Date
Name
Owned For
Owner Type
Purchase Details
Closed on
Mar 21, 2008
Sold by
Brock Travis and Brock Shekovia S
Bought by
Brock Travis J
Current Estimated Value
Home Financials for this Owner
Home Financials are based on the most recent Mortgage that was taken out on this home.
Original Mortgage
$91,800
Outstanding Balance
$57,892
Interest Rate
5.97%
Mortgage Type
New Conventional
Estimated Equity
$57,358
Purchase Details
Closed on
May 24, 2007
Sold by
Brock Travis
Bought by
Brock Travis and Brock Shekovia S
Purchase Details
Closed on
May 10, 2007
Sold by
Brown Phifer Angel Anduze
Bought by
Brock Travis
Purchase Details
Closed on
Nov 10, 1999
Sold by
Holeman Doris S
Bought by
Anduze Julien Aka Julien Ashmore An
Purchase Details
Closed on
Sep 16, 1994
Sold by
Davenport Charles J
Bought by
Holeman Doris S
Purchase Details
Closed on
Feb 22, 1978
Sold by
Story Larry and Story Marga
Bought by
Davenport Charles J
Create a Home Valuation Report for This Property
The Home Valuation Report is an in-depth analysis detailing your home's value as well as a comparison with similar homes in the area
Home Values in the Area
Average Home Value in this Area
Purchase History
| Date | Buyer | Sale Price | Title Company |
|---|---|---|---|
| Brock Travis J | -- | -- | |
| Brock Travis | -- | -- | |
| Brock Travis | $60,900 | -- | |
| Brown Phifer Angel | -- | -- | |
| Anduze Julien Aka Julien Ashmore An | $56,900 | -- | |
| Holeman Doris S | $48,200 | -- | |
| Davenport Charles J | -- | -- |
Source: Public Records
Mortgage History
| Date | Status | Borrower | Loan Amount |
|---|---|---|---|
| Open | Brock Travis J | $91,800 |
Source: Public Records
Tax History Compared to Growth
Tax History
| Year | Tax Paid | Tax Assessment Tax Assessment Total Assessment is a certain percentage of the fair market value that is determined by local assessors to be the total taxable value of land and additions on the property. | Land | Improvement |
|---|---|---|---|---|
| 2024 | $1,435 | $32,080 | $5,080 | $27,000 |
| 2023 | $563 | $32,080 | $5,080 | $27,000 |
| 2022 | $1,407 | $32,080 | $5,080 | $27,000 |
| 2021 | $1,304 | $32,080 | $5,080 | $27,000 |
| 2020 | $1,307 | $32,080 | $5,080 | $27,000 |
| 2019 | $1,312 | $32,080 | $5,080 | $27,000 |
| 2018 | $1,318 | $32,080 | $5,080 | $27,000 |
| 2017 | $1,227 | $32,080 | $5,080 | $27,000 |
| 2016 | $1,228 | $32,080 | $5,080 | $27,000 |
| 2015 | $1,232 | $32,080 | $5,080 | $27,000 |
| 2014 | $1,132 | $30,000 | $3,000 | $27,000 |
Source: Public Records
Map
Nearby Homes
- 802 Colquitt Cir
- 1714 W Lincoln Ave
- 1804 W Lincoln Ave
- 1918 Colquitt Ave
- 1513 Colquitt Ave
- 2013 Jones Ave
- 1904 Avalon Ave
- 400 S Shadowlawn Dr
- 1804 W Whitney Ave
- 1604 W Whitney Ave
- 1501 Avalon Ave
- 1408 W Gordon Ave
- 1409 Colquitt Ave
- 1700 Edgerly Ave
- 1413 Avalon Ave
- 1810 Edgerly Ave
- 1906 W Whitney Ave
- 1415 W Whitney Ave
- 410 Endicott Ln
- 1416 Edgerly Ave
- 717 S Shadowlawn Dr
- 713 S Shadowlawn Dr
- 719 S Shadowlawn Dr
- 711 S Shadowlawn Dr
- 721 S Shadowlawn Dr
- 709 S Shadowlawn Dr
- 707 S Magnolia St
- 706 S Shadowlawn Dr
- 808 Colquitt Cir
- 806 Colquitt Cir
- 704 S Shadowlawn Dr
- 810 Colquitt Cir
- 707 S Shadowlawn Dr
- 702 S Shadowlawn Dr
- 804 Colquitt Cir
- 723 S Shadowlawn Dr
- 705 S Magnolia St
- 710 S Shadowlawn Dr
- 1/3/5 Colquitt Cir
- 812 Colquitt Cir