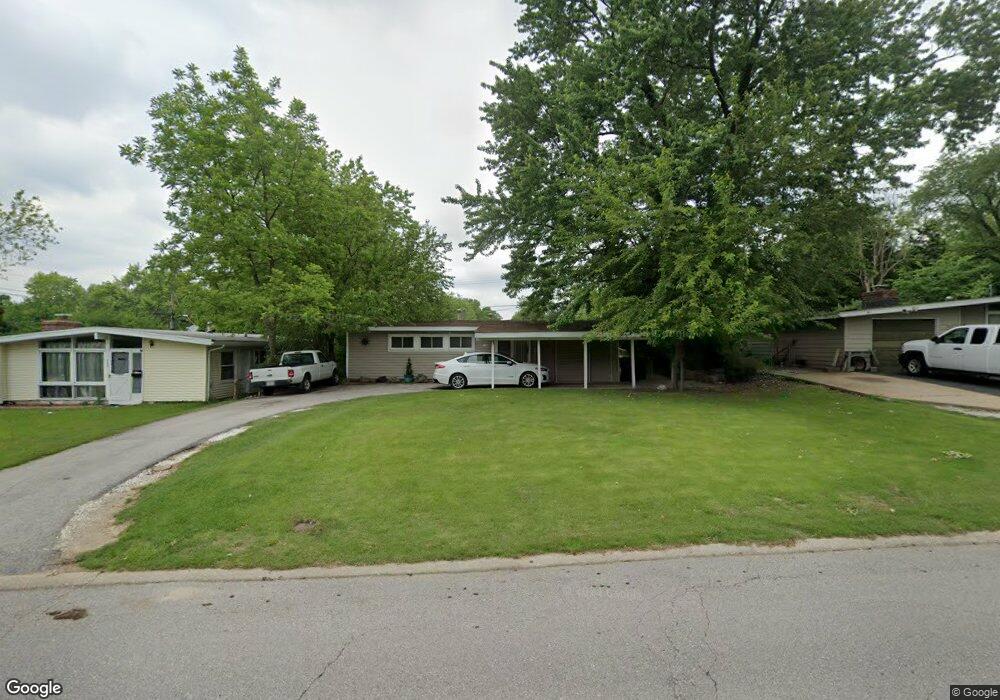
715 Saint Anthony Ln Florissant, MO 63033
Estimated Value: $142,000 - $172,000
3
Beds
1
Bath
1,287
Sq Ft
$122/Sq Ft
Est. Value
About This Home
This home is located at 715 Saint Anthony Ln, Florissant, MO 63033 and is currently estimated at $156,598, approximately $121 per square foot. 715 Saint Anthony Ln is a home located in St. Louis County with nearby schools including Duchesne Elementary School, Cross Keys Middle School, and McCluer North High School.
Ownership History
Date
Name
Owned For
Owner Type
Purchase Details
Closed on
Aug 10, 2009
Sold by
Hsbc Mortgage Services Inc
Bought by
Vanvalin Steven and Van Valin Jamie L
Current Estimated Value
Purchase Details
Closed on
Apr 7, 2009
Sold by
Maddock Brandin K
Bought by
Hsbc Mortgage Services Inc
Purchase Details
Closed on
Sep 20, 2005
Sold by
Scott Susan K
Bought by
Maddock Brandin K
Home Financials for this Owner
Home Financials are based on the most recent Mortgage that was taken out on this home.
Original Mortgage
$94,400
Interest Rate
7.8%
Mortgage Type
Fannie Mae Freddie Mac
Purchase Details
Closed on
Mar 3, 2005
Sold by
Powers Mary Beth
Bought by
Scott Susan K
Home Financials for this Owner
Home Financials are based on the most recent Mortgage that was taken out on this home.
Original Mortgage
$60,000
Interest Rate
10%
Mortgage Type
Purchase Money Mortgage
Create a Home Valuation Report for This Property
The Home Valuation Report is an in-depth analysis detailing your home's value as well as a comparison with similar homes in the area
Home Values in the Area
Average Home Value in this Area
Purchase History
| Date | Buyer | Sale Price | Title Company |
|---|---|---|---|
| Vanvalin Steven | $37,000 | Us Title North | |
| Hsbc Mortgage Services Inc | $46,000 | None Available | |
| Maddock Brandin K | $118,000 | Davis Title & Abstract Co | |
| Scott Susan K | $60,000 | Touchstone Title |
Source: Public Records
Mortgage History
| Date | Status | Borrower | Loan Amount |
|---|---|---|---|
| Previous Owner | Maddock Brandin K | $94,400 | |
| Previous Owner | Scott Susan K | $60,000 |
Source: Public Records
Tax History Compared to Growth
Tax History
| Year | Tax Paid | Tax Assessment Tax Assessment Total Assessment is a certain percentage of the fair market value that is determined by local assessors to be the total taxable value of land and additions on the property. | Land | Improvement |
|---|---|---|---|---|
| 2025 | $1,604 | $23,470 | $6,180 | $17,290 |
| 2024 | $1,604 | $20,520 | $4,640 | $15,880 |
| 2023 | $1,598 | $20,520 | $4,640 | $15,880 |
| 2022 | $1,432 | $16,120 | $4,640 | $11,480 |
| 2021 | $1,408 | $16,120 | $4,640 | $11,480 |
| 2020 | $1,278 | $13,810 | $3,570 | $10,240 |
| 2019 | $1,254 | $13,810 | $3,570 | $10,240 |
| 2018 | $1,035 | $10,140 | $2,050 | $8,090 |
| 2017 | $1,030 | $10,140 | $2,050 | $8,090 |
| 2016 | $1,036 | $9,950 | $2,050 | $7,900 |
| 2015 | $1,042 | $9,950 | $2,050 | $7,900 |
| 2014 | $891 | $8,740 | $3,460 | $5,280 |
Source: Public Records
Map
Nearby Homes
- 785 Bobbins Ln
- 2320 Allen Dr
- 2240 Brook Dr
- 750 Robinwood Dr
- 12 Country Ln
- 805 Derhake Rd
- 505 Ridge Dr
- 2340 Saint Catherine St
- 13 Bayberry Ln
- 2020 Washington St Unit 707
- 2505 Saint Catherine St
- 1965 Saint Catherine St
- 675 Pimlico Dr
- 105 Capri Dr
- 765 Pimlico Dr
- 130 Dauphin Ln
- 265 Waterford Dr
- 190 Coteau Ln
- 150 Saint Daniel Ln
- 2 Carson Ct
- 725 Saint Anthony Ln
- 705 Saint Anthony Ln
- 2200 Allen Dr
- 735 Saint Anthony Ln
- 695 Saint Anthony Ln
- 2180 Allen Dr
- 2220 Allen Dr
- 185 Taney Dr
- 310 Saint Edward Ln
- 745 Saint Anthony Ln
- 300 Saint Edward Ln
- 2240 Allen Dr
- 180 Taney Dr
- 175 Taney Dr
- 700 Saint Anthony Ln
- 1960 Allen Dr
- 2260 Allen Dr
- 755 Saint Anthony Ln
- 170 Taney Dr
- 750 Saint Anthony Ln