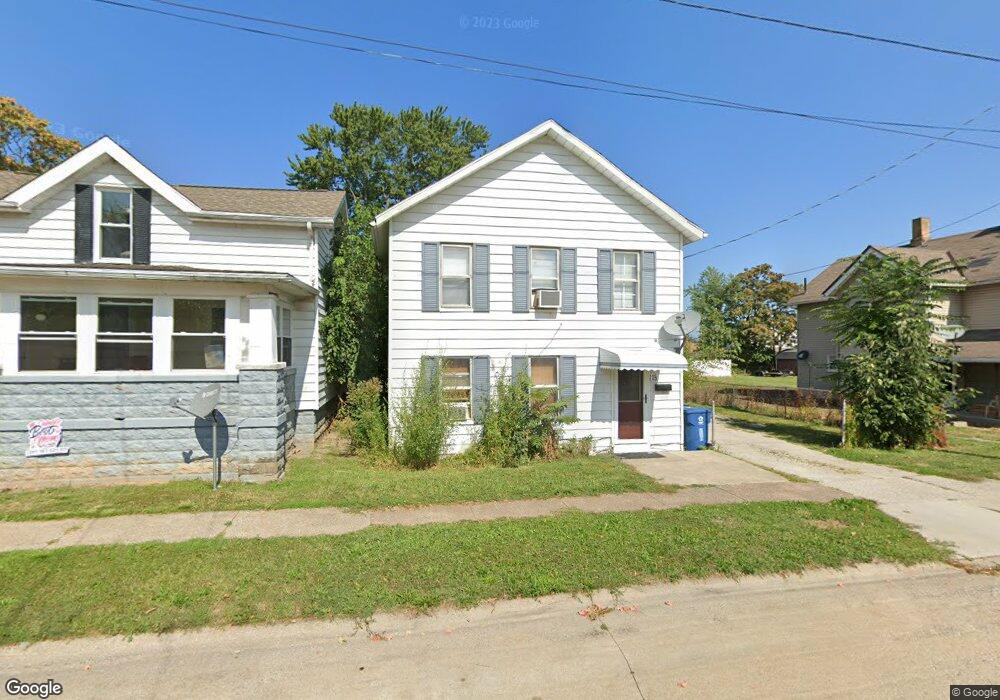
715 Sycamore St Sandusky, OH 44870
Estimated Value: $108,989 - $242,000
4
Beds
1
Bath
1,540
Sq Ft
$100/Sq Ft
Est. Value
About This Home
This home is located at 715 Sycamore St, Sandusky, OH 44870 and is currently estimated at $153,247, approximately $99 per square foot. 715 Sycamore St is a home located in Erie County with nearby schools including Sandusky High School, Monroe Preparatory Academy, and Sandusky Central Catholic School.
Ownership History
Date
Name
Owned For
Owner Type
Purchase Details
Closed on
Dec 6, 2015
Sold by
Allensworth Tod R
Bought by
Allensworth Chelsea R
Current Estimated Value
Purchase Details
Closed on
Sep 15, 2015
Sold by
Allensworth Kimberly L
Bought by
Allensworth Chelsea R
Purchase Details
Closed on
Nov 8, 2007
Sold by
Butler William P
Bought by
Allensworth Tod R and Allensworth Kimberly L
Home Financials for this Owner
Home Financials are based on the most recent Mortgage that was taken out on this home.
Original Mortgage
$47,680
Interest Rate
6.47%
Mortgage Type
New Conventional
Purchase Details
Closed on
Oct 10, 2007
Sold by
Butler Deborah E
Bought by
Butler William P
Home Financials for this Owner
Home Financials are based on the most recent Mortgage that was taken out on this home.
Original Mortgage
$47,680
Interest Rate
6.47%
Mortgage Type
New Conventional
Create a Home Valuation Report for This Property
The Home Valuation Report is an in-depth analysis detailing your home's value as well as a comparison with similar homes in the area
Home Values in the Area
Average Home Value in this Area
Purchase History
We collect this data history from publicly available records. To have your information removed, we recommend requesting removal directly through your county’s website.
| Date | Buyer | Sale Price | Title Company |
|---|---|---|---|
| Allensworth Chelsea R | -- | Attorney | |
| Allensworth Chelsea R | -- | None Available | |
| Allensworth Tod R | $59,600 | Lawyers Title Ins Corp | |
| Butler William P | -- | None Available |
Source: Public Records
Mortgage History
We collect this data history from publicly available records. To have your information removed, we recommend requesting removal directly through your county’s website.
| Date | Status | Borrower | Loan Amount |
|---|---|---|---|
| Closed | Allensworth Tod R | $47,680 |
Source: Public Records
Tax History
| Year | Tax Paid | Tax Assessment Tax Assessment Total Assessment is a certain percentage of the fair market value that is determined by local assessors to be the total taxable value of land and additions on the property. | Land | Improvement |
|---|---|---|---|---|
| 2025 | $718 | $19,284 | $4,553 | $14,731 |
| 2024 | $718 | $19,284 | $4,553 | $14,731 |
| 2023 | $742 | $16,506 | $3,570 | $12,936 |
| 2022 | $817 | $16,502 | $3,570 | $12,932 |
| 2021 | $825 | $16,500 | $3,570 | $12,930 |
| 2020 | $822 | $15,120 | $3,570 | $11,550 |
| 2019 | $846 | $15,120 | $3,570 | $11,550 |
| 2018 | $846 | $15,120 | $3,570 | $11,550 |
| 2017 | $851 | $15,150 | $4,640 | $10,510 |
| 2016 | $850 | $15,150 | $4,640 | $10,510 |
| 2015 | $1,179 | $23,270 | $4,640 | $18,630 |
| 2014 | $1,172 | $23,270 | $4,640 | $18,630 |
| 2013 | $1,160 | $23,270 | $4,640 | $18,630 |
Source: Public Records
Map
Nearby Homes
- 616 Meigs St
- 3 Curran St
- 4 Curran St
- 808 Curran St
- 412 Anderson St
- 444 Hasting Dr
- 621 Reese St
- 403 E Adams St
- 1035 1st St
- 615 Neil St
- 519 Huron Ave
- 519 Neil St
- 628 Hancock St
- 423 Hancock St
- 903 Franklin St
- 1110 3rd St
- 908 Ontario St
- 0 Milan Rd Unit 3997231
- 0 Milan Rd Unit 3805445
- 0 Milan Rd Unit 20182198
Your Personal Tour Guide
Ask me questions while you tour the home.