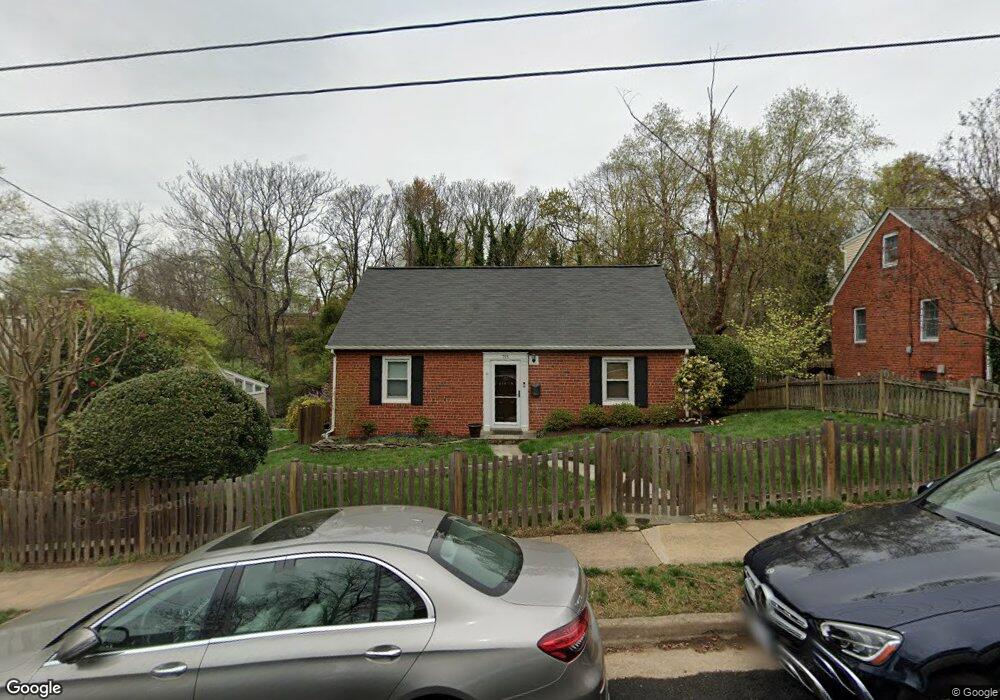
715 Upland Place Alexandria, VA 22314
Taylor Run NeighborhoodEstimated Value: $843,000 - $947,000
3
Beds
2
Baths
1,558
Sq Ft
$585/Sq Ft
Est. Value
About This Home
This home is located at 715 Upland Place, Alexandria, VA 22314 and is currently estimated at $911,127, approximately $584 per square foot. 715 Upland Place is a home located in Alexandria City with nearby schools including Douglas Macarthur Elementary School, George Washington Middle School, and Alexandria City High School.
Ownership History
Date
Name
Owned For
Owner Type
Purchase Details
Closed on
Jun 1, 2021
Sold by
Beinhacker David and Beinhacker Christine
Bought by
Beinhacker David Jason and Beinhacker Christine Marie
Current Estimated Value
Purchase Details
Closed on
Aug 27, 1999
Sold by
Ryder John D
Bought by
Beinhacker David
Home Financials for this Owner
Home Financials are based on the most recent Mortgage that was taken out on this home.
Original Mortgage
$192,000
Outstanding Balance
$55,654
Interest Rate
7.53%
Estimated Equity
$855,473
Purchase Details
Closed on
Jul 23, 1997
Sold by
Sullivan Martin A and Sullivan Mary E
Bought by
Ryder John D
Home Financials for this Owner
Home Financials are based on the most recent Mortgage that was taken out on this home.
Original Mortgage
$176,800
Interest Rate
7.7%
Mortgage Type
New Conventional
Create a Home Valuation Report for This Property
The Home Valuation Report is an in-depth analysis detailing your home's value as well as a comparison with similar homes in the area
Home Values in the Area
Average Home Value in this Area
Purchase History
| Date | Buyer | Sale Price | Title Company |
|---|---|---|---|
| Beinhacker David Jason | -- | None Available | |
| Beinhacker David | $240,000 | -- | |
| Ryder John D | $221,000 | Island Title Corp |
Source: Public Records
Mortgage History
| Date | Status | Borrower | Loan Amount |
|---|---|---|---|
| Open | Beinhacker David | $192,000 | |
| Previous Owner | Ryder John D | $176,800 |
Source: Public Records
Tax History Compared to Growth
Tax History
| Year | Tax Paid | Tax Assessment Tax Assessment Total Assessment is a certain percentage of the fair market value that is determined by local assessors to be the total taxable value of land and additions on the property. | Land | Improvement |
|---|---|---|---|---|
| 2025 | $9,760 | $804,532 | $471,562 | $332,970 |
| 2024 | $9,760 | $787,970 | $455,000 | $332,970 |
| 2023 | $8,746 | $787,970 | $455,000 | $332,970 |
| 2022 | $8,326 | $750,109 | $433,283 | $316,826 |
| 2021 | $7,990 | $719,839 | $433,283 | $286,556 |
| 2020 | $8,159 | $677,404 | $412,650 | $264,754 |
| 2019 | $7,562 | $669,228 | $412,650 | $256,578 |
| 2018 | $7,225 | $639,396 | $393,000 | $246,396 |
| 2017 | $6,839 | $605,194 | $375,000 | $230,194 |
| 2016 | $6,494 | $605,194 | $375,000 | $230,194 |
| 2015 | $6,380 | $611,670 | $340,000 | $271,670 |
| 2014 | $6,079 | $582,848 | $315,000 | $267,848 |
Source: Public Records
Map
Nearby Homes
- 130 Roberts Ln Unit 200
- 130 Roberts Ln Unit 201
- 126 Roberts Ln Unit 101
- 122 Roberts Ln Unit 400
- 132 Roberts Ln Unit 303
- 110 Roberts Ln Unit 301
- 133 E Taylor Run Pkwy
- 131 E Taylor Run Pkwy
- 607 W View Terrace
- 102 Roberts Ln Unit 100
- 59 E Taylor Run Pkwy
- 605 Hilltop Terrace
- 53 Skyhill Rd Unit 204
- 51 Skyhill Rd Unit 202
- 49 Skyhill Rd Unit 201
- 206 N View Terrace
- 205 Vassar Place
- 2700 Bryan Place
- 620 Melrose St
- 2151 Jamieson Ave Unit 809
- 719 Upland Place
- 711 Upland Place
- 723 Upland Place
- 707 Upland Place
- 720 Upland Place
- 712 Upland Place
- 724 Upland Place
- 708 Upland Place
- 727 Upland Place
- 703 Upland Place
- 130 Roberts Ln Unit 101
- 130 Roberts Ln Unit 100
- 130 Roberts Ln Unit 300
- 130 Roberts Ln Unit 401
- 130 Roberts Ln Unit 400
- 130 Roberts Ln Unit 301
- 728 Upland Place
- 635 Upland Place
- 704 Upland Place
- 731 Upland Place