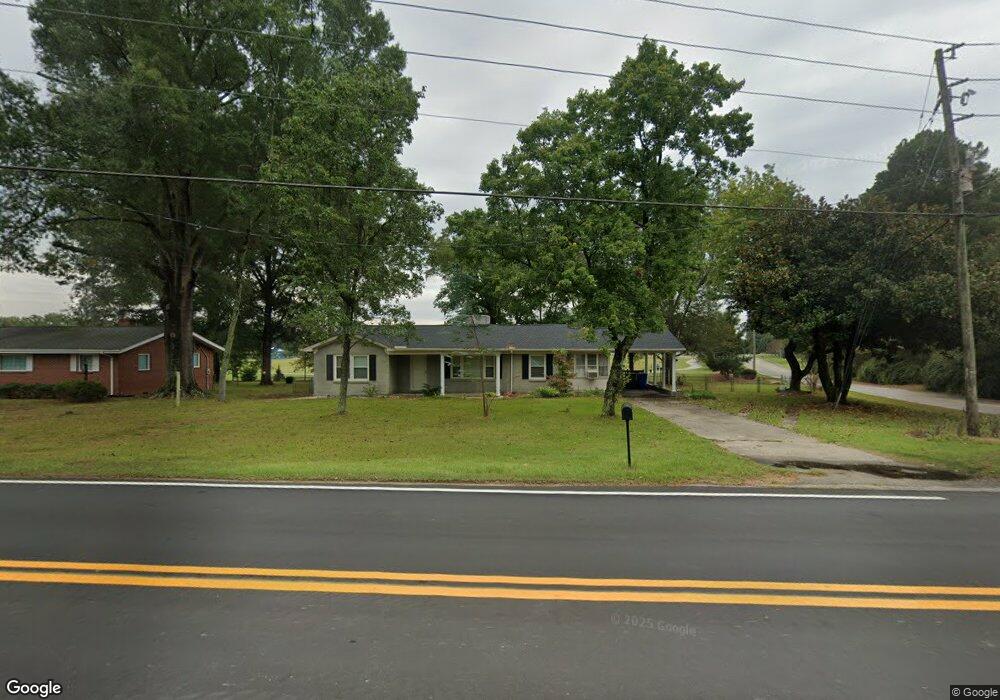
715 W Academy St Fuquay Varina, NC 27526
Estimated Value: $294,000 - $449,000
3
Beds
4
Baths
1,685
Sq Ft
$210/Sq Ft
Est. Value
About This Home
This home is located at 715 W Academy St, Fuquay Varina, NC 27526 and is currently estimated at $353,968, approximately $210 per square foot. 715 W Academy St is a home located in Wake County with nearby schools including Holly Grove Middle School, Fuquay-Varina High, and Southern Wake Academy.
Ownership History
Date
Name
Owned For
Owner Type
Purchase Details
Closed on
Dec 1, 2006
Sold by
Britton Timothy J and Britton Cheryl Lynn
Bought by
Hunter John Henry and Hunter Dorothy Jean
Current Estimated Value
Purchase Details
Closed on
Dec 3, 1999
Sold by
Vuncannon Vuncannon Jason O Neal
Bought by
Britton Timothy J and Britton Cheryl Lynn
Home Financials for this Owner
Home Financials are based on the most recent Mortgage that was taken out on this home.
Original Mortgage
$135,225
Interest Rate
7.94%
Mortgage Type
FHA
Purchase Details
Closed on
Aug 3, 1998
Sold by
Campbell Junius D
Bought by
Vuncannon Jason Oneal and Vuncannon Jamie Atkins
Home Financials for this Owner
Home Financials are based on the most recent Mortgage that was taken out on this home.
Original Mortgage
$119,000
Interest Rate
6.94%
Create a Home Valuation Report for This Property
The Home Valuation Report is an in-depth analysis detailing your home's value as well as a comparison with similar homes in the area
Home Values in the Area
Average Home Value in this Area
Purchase History
| Date | Buyer | Sale Price | Title Company |
|---|---|---|---|
| Hunter John Henry | $140,000 | None Available | |
| Britton Timothy J | $136,000 | -- | |
| Vuncannon Jason Oneal | $124,000 | -- |
Source: Public Records
Mortgage History
| Date | Status | Borrower | Loan Amount |
|---|---|---|---|
| Previous Owner | Britton Timothy J | $135,225 | |
| Previous Owner | Vuncannon Jason Oneal | $119,000 |
Source: Public Records
Tax History Compared to Growth
Tax History
| Year | Tax Paid | Tax Assessment Tax Assessment Total Assessment is a certain percentage of the fair market value that is determined by local assessors to be the total taxable value of land and additions on the property. | Land | Improvement |
|---|---|---|---|---|
| 2025 | $2,548 | $288,906 | $76,500 | $212,406 |
| 2024 | $2,538 | $288,906 | $76,500 | $212,406 |
| 2023 | $1,982 | $176,438 | $30,000 | $146,438 |
| 2022 | $1,863 | $176,438 | $30,000 | $146,438 |
| 2021 | $1,776 | $176,438 | $30,000 | $146,438 |
| 2020 | $1,776 | $176,438 | $30,000 | $146,438 |
| 2019 | $1,664 | $142,546 | $30,000 | $112,546 |
| 2018 | $1,569 | $142,546 | $30,000 | $112,546 |
| 2017 | $1,513 | $142,546 | $30,000 | $112,546 |
| 2016 | $1,493 | $142,546 | $30,000 | $112,546 |
| 2015 | $1,450 | $143,029 | $33,000 | $110,029 |
| 2014 | $1,397 | $143,029 | $33,000 | $110,029 |
Source: Public Records
Map
Nearby Homes
- 905 Nakina Dr
- 664 Lavenham Ln
- 1102 Noor Ln
- 637 Stapleford Ln
- 1106 Noor Ln
- 1114 Noor Ln
- 1175 Kafka Dr
- 909 Sunset Dr
- 137 Coley Farm Rd
- 716 Parker St
- 610 Silk Tree Trace
- 516 Smithridge Way
- 724 Lucky Clover Way
- 722 Lucky Clover Way
- 766 Dorset Stream Dr
- 720 Lucky Clover Way
- 1108 Summer Meadow Dr
- 764 Dorset Stream Dr
- 718 Lucky Clover Way
- 716 Lucky Clover Way
- 713 W Academy St
- 801 W Academy St
- 711 W Academy St
- 802 W Academy St
- 809 Mossy Oak Dr
- 803 W Academy St
- 805 Mossy Oak Dr
- 813 Mossy Oak Dr
- 709 W Academy St
- 801 Mossy Oak Dr
- 805 W Academy St
- LOT 35 Mossy Oak Dr
- Lot 13 Mossy Oak Dr
- 904 Nakina Dr
- 705 W Academy St
- 807 W Academy St
- 812 Mossy Oak Dr
- 808 Mossy Oak Dr
- 804 Mossy Oak Dr
- 405 Cameronwood Dr