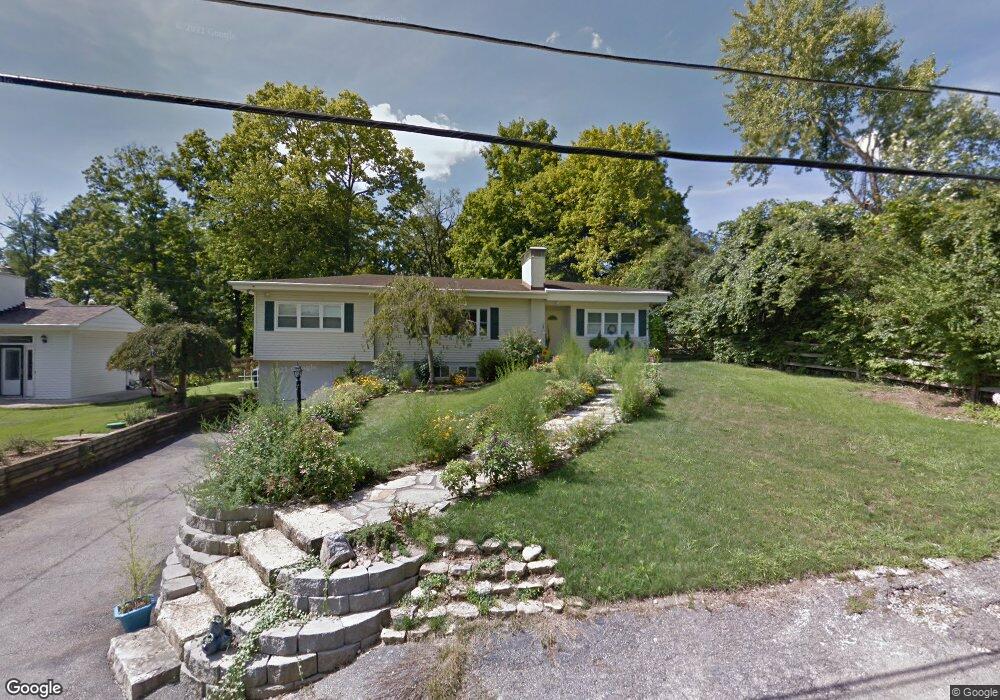
7151 Dearwester Dr Cincinnati, OH 45236
Estimated Value: $372,000 - $623,000
3
Beds
3
Baths
2,272
Sq Ft
$222/Sq Ft
Est. Value
About This Home
This home is located at 7151 Dearwester Dr, Cincinnati, OH 45236 and is currently estimated at $504,602, approximately $222 per square foot. 7151 Dearwester Dr is a home located in Hamilton County with nearby schools including Indian Hill Primary School, Indian Hill Elementary School, and Indian Hill Middle School.
Ownership History
Date
Name
Owned For
Owner Type
Purchase Details
Closed on
Oct 4, 2010
Sold by
Deutsche Bank National Trust Company
Bought by
Fiore Lyle
Current Estimated Value
Purchase Details
Closed on
Jul 21, 2010
Sold by
Collura Cynthia C
Bought by
Deutsche Bank National Trust Company
Purchase Details
Closed on
Jun 25, 2004
Sold by
Gerber Troy
Bought by
Collura Patrick P and Collura Cynthia C
Home Financials for this Owner
Home Financials are based on the most recent Mortgage that was taken out on this home.
Original Mortgage
$202,500
Interest Rate
7.75%
Mortgage Type
Unknown
Purchase Details
Closed on
May 20, 1999
Sold by
Schneider Joseph C and Schneider Nancy M
Bought by
Gerber Troy
Home Financials for this Owner
Home Financials are based on the most recent Mortgage that was taken out on this home.
Original Mortgage
$117,200
Interest Rate
6.94%
Purchase Details
Closed on
Dec 10, 1997
Sold by
Angel Francise M and Angel David C
Bought by
Schneider Joe and Schneider Joseph C
Create a Home Valuation Report for This Property
The Home Valuation Report is an in-depth analysis detailing your home's value as well as a comparison with similar homes in the area
Home Values in the Area
Average Home Value in this Area
Purchase History
| Date | Buyer | Sale Price | Title Company |
|---|---|---|---|
| Fiore Lyle | $150,500 | None Available | |
| Deutsche Bank National Trust Company | $130,000 | None Available | |
| Collura Patrick P | -- | -- | |
| Gerber Troy | $146,500 | -- | |
| Schneider Joe | $146,000 | -- |
Source: Public Records
Mortgage History
| Date | Status | Borrower | Loan Amount |
|---|---|---|---|
| Previous Owner | Collura Patrick P | $202,500 | |
| Previous Owner | Gerber Troy | $117,200 |
Source: Public Records
Tax History Compared to Growth
Tax History
| Year | Tax Paid | Tax Assessment Tax Assessment Total Assessment is a certain percentage of the fair market value that is determined by local assessors to be the total taxable value of land and additions on the property. | Land | Improvement |
|---|---|---|---|---|
| 2023 | $4,603 | $117,047 | $40,656 | $76,391 |
| 2022 | $4,109 | $85,470 | $28,966 | $56,504 |
| 2021 | $4,002 | $85,470 | $28,966 | $56,504 |
| 2020 | $3,571 | $85,470 | $28,966 | $56,504 |
| 2019 | $3,359 | $74,974 | $25,410 | $49,564 |
| 2018 | $3,493 | $74,974 | $25,410 | $49,564 |
| 2017 | $3,386 | $74,974 | $25,410 | $49,564 |
| 2016 | $2,471 | $53,494 | $23,562 | $29,932 |
| 2015 | $2,451 | $53,494 | $23,562 | $29,932 |
| 2014 | $2,431 | $53,494 | $23,562 | $29,932 |
| 2013 | $2,470 | $52,444 | $23,100 | $29,344 |
Source: Public Records
Map
Nearby Homes
- 8530 Sturbridge Dr
- 6494 Pepperell Ln
- 6640 Kugler Mill Rd
- 7268 E Galbraith Rd
- 6385 Kugler Mill Rd
- 5760 Kugler Mill Rd
- 7936 Keller Rd
- 7747 Kugler Mill Rd
- 7311 Timberknoll Dr
- 4859 Marieview Ct
- 7800 Hosbrook Rd
- 6399 Donjoy Dr
- 7300 N Mingo Ln
- 8814 Kenwood Rd
- 8539 Wilton Ave
- 8549 Wilton Ave
- 7775 Hartfield Place
- 7925 Spiritwood Ct
- 9299 Fidelis Dr
- 8811 Pine Rd
- 7223 Dearwester Dr
- 7221 Dearwester Dr
- 7081 Dearwester Dr
- 2 Dearwester Dr
- 1 Dearwester Dr
- 6638 Branford Ct
- 7219 Dearwester Dr
- 6626 Branford Ct
- 6650 Branford Ct
- 6981 Dearwester Dr
- 6614 Branford Ct
- 6649 Branford Ct
- 6602 Branford Ct
- 8549 Montgomery Rd Unit C
- 6635 Branford Ct
- 6623 Branford Ct
- 6901 Dearwester Dr
- 8494 Wetherfield Ln
- 6588 Branford Ct
- 8510 Sturbridge Dr