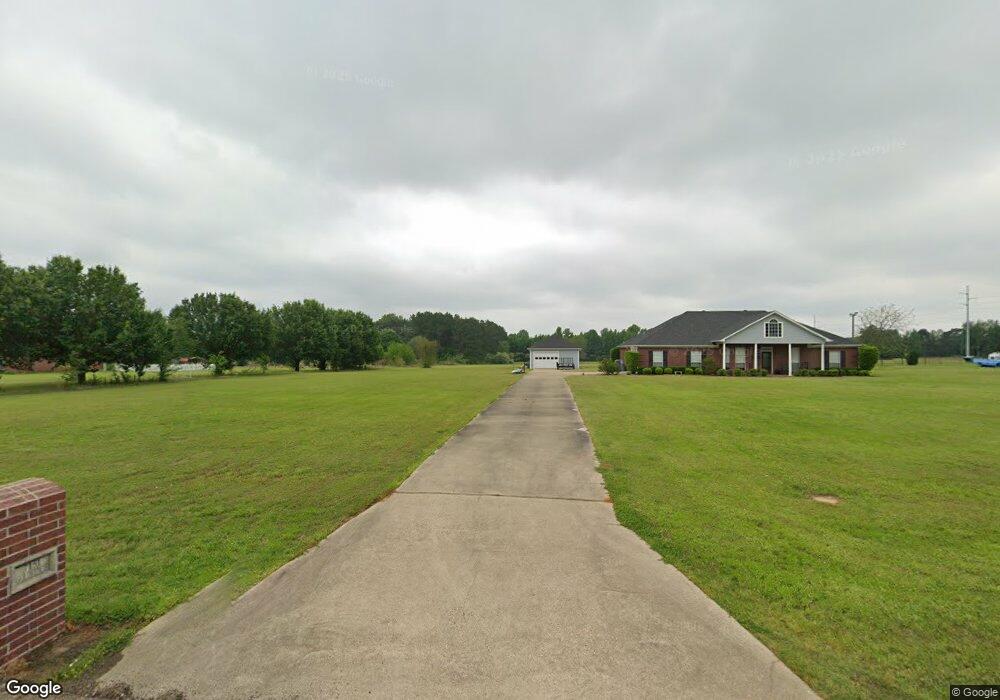
7151 Goldfinch Rd Texarkana, TX 75501
Estimated Value: $288,000 - $374,153
--
Bed
--
Bath
2,261
Sq Ft
$146/Sq Ft
Est. Value
About This Home
This home is located at 7151 Goldfinch Rd, Texarkana, TX 75501 and is currently estimated at $331,077, approximately $146 per square foot. 7151 Goldfinch Rd is a home located in Bowie County with nearby schools including Nash Elementary School, Texas Middle School, and Texas High School.
Ownership History
Date
Name
Owned For
Owner Type
Purchase Details
Closed on
Aug 31, 2020
Sold by
Norton William S and Norton Melody
Bought by
Burgess George Duane and Burgess Carla Jean
Current Estimated Value
Home Financials for this Owner
Home Financials are based on the most recent Mortgage that was taken out on this home.
Original Mortgage
$189,900
Outstanding Balance
$168,455
Interest Rate
3%
Mortgage Type
New Conventional
Estimated Equity
$162,622
Purchase Details
Closed on
Aug 31, 2018
Sold by
Williams Jere A and Williams Johna L
Bought by
Norton William S and Norton Melody
Home Financials for this Owner
Home Financials are based on the most recent Mortgage that was taken out on this home.
Original Mortgage
$214,000
Interest Rate
4.5%
Mortgage Type
Purchase Money Mortgage
Create a Home Valuation Report for This Property
The Home Valuation Report is an in-depth analysis detailing your home's value as well as a comparison with similar homes in the area
Home Values in the Area
Average Home Value in this Area
Purchase History
| Date | Buyer | Sale Price | Title Company |
|---|---|---|---|
| Burgess George Duane | -- | None Available | |
| Norton William S | -- | None Available |
Source: Public Records
Mortgage History
| Date | Status | Borrower | Loan Amount |
|---|---|---|---|
| Open | Burgess George Duane | $189,900 | |
| Previous Owner | Norton William S | $214,000 |
Source: Public Records
Tax History Compared to Growth
Tax History
| Year | Tax Paid | Tax Assessment Tax Assessment Total Assessment is a certain percentage of the fair market value that is determined by local assessors to be the total taxable value of land and additions on the property. | Land | Improvement |
|---|---|---|---|---|
| 2025 | $6,066 | $384,045 | $61,740 | $322,305 |
| 2024 | $6,066 | $375,903 | $61,740 | $314,163 |
| 2023 | $7,097 | $351,667 | $0 | $0 |
| 2022 | $6,568 | $394,522 | $69,153 | $325,369 |
| 2021 | $6,440 | $290,634 | $45,870 | $244,764 |
| 2020 | $6,239 | $279,845 | $45,870 | $233,975 |
| 2019 | $6,271 | $269,563 | $45,870 | $223,693 |
| 2018 | $5,843 | $261,636 | $45,870 | $215,766 |
| 2017 | $5,295 | $228,343 | $40,696 | $187,647 |
| 2016 | $5,295 | $228,343 | $40,696 | $187,647 |
| 2015 | $4,584 | $226,685 | $40,696 | $185,989 |
| 2014 | $4,584 | $219,293 | $40,696 | $178,597 |
Source: Public Records
Map
Nearby Homes
- 11 Cardinal Ln
- 694 Fomby Ln
- 830 Kelly Rd
- 901 Conway Dr
- 1408 N Fm 2148
- 205 E Heather
- 821 Tri State Rd
- 14 Red Springs Rd
- TBD County Road 1304
- 115 Geneva St
- 795 B K Pickering Dr
- 86 Piney Grove Cir
- 107 Lampasas Way
- 206 Pine Forest St
- 201 Pine Forest St
- 1721 Tri State Rd
- 105 Eastline Rd
- 1103 N Kings Hwy
- TBD Tri State Rd
- 71 Macedonia Rd Unit 71 Macedonia RD