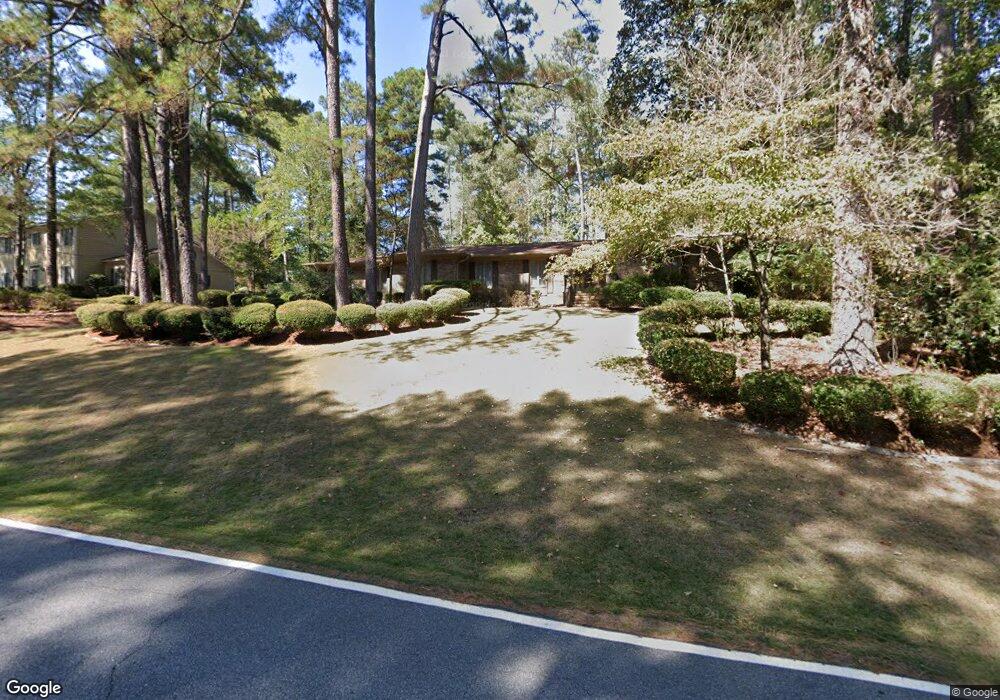
7152 Standing Boy Rd Columbus, GA 31904
North Columbus NeighborhoodEstimated Value: $359,000 - $445,000
3
Beds
3
Baths
3,167
Sq Ft
$130/Sq Ft
Est. Value
About This Home
This home is located at 7152 Standing Boy Rd, Columbus, GA 31904 and is currently estimated at $412,967, approximately $130 per square foot. 7152 Standing Boy Rd is a home located in Muscogee County with nearby schools including River Road Elementary School, Double Churches Middle School, and Northside High School.
Ownership History
Date
Name
Owned For
Owner Type
Purchase Details
Closed on
Mar 23, 2016
Sold by
Synovus Bank
Bought by
Mcbride Marvin and Mcbride Susan
Current Estimated Value
Purchase Details
Closed on
Sep 27, 2013
Sold by
Shroff Payal
Bought by
Synovus Bank
Purchase Details
Closed on
Oct 2, 2009
Sold by
Shroff Payal
Bought by
Shroff Payal and Shroff Kaizad Percy
Home Financials for this Owner
Home Financials are based on the most recent Mortgage that was taken out on this home.
Original Mortgage
$280,000
Interest Rate
3.99%
Purchase Details
Closed on
May 10, 2007
Sold by
Lunsford Brian L
Bought by
Lunsford Stephanie K
Home Financials for this Owner
Home Financials are based on the most recent Mortgage that was taken out on this home.
Original Mortgage
$260,000
Interest Rate
6.11%
Create a Home Valuation Report for This Property
The Home Valuation Report is an in-depth analysis detailing your home's value as well as a comparison with similar homes in the area
Home Values in the Area
Average Home Value in this Area
Purchase History
| Date | Buyer | Sale Price | Title Company |
|---|---|---|---|
| Mcbride Marvin | $225,000 | -- | |
| Synovus Bank | $345,960 | -- | |
| Shroff Payal | -- | None Available | |
| Shroff Payal | $350,000 | None Available | |
| Lunsford Stephanie K | -- | None Available | |
| Lunsford Brian L | $330,000 | None Available |
Source: Public Records
Mortgage History
| Date | Status | Borrower | Loan Amount |
|---|---|---|---|
| Previous Owner | Shroff Payal | $280,000 | |
| Previous Owner | Lunsford Brian L | $260,000 |
Source: Public Records
Tax History
| Year | Tax Paid | Tax Assessment Tax Assessment Total Assessment is a certain percentage of the fair market value that is determined by local assessors to be the total taxable value of land and additions on the property. | Land | Improvement |
|---|---|---|---|---|
| 2025 | $3,007 | $150,684 | $31,276 | $119,408 |
| 2024 | $301 | $150,684 | $31,276 | $119,408 |
| 2023 | $2,331 | $150,684 | $31,276 | $119,408 |
| 2022 | $3,135 | $126,092 | $31,276 | $94,816 |
| 2021 | $3,128 | $124,320 | $31,276 | $93,044 |
| 2020 | $3,129 | $124,320 | $31,276 | $93,044 |
| 2019 | $3,141 | $124,320 | $31,276 | $93,044 |
| 2018 | $3,141 | $124,320 | $31,276 | $93,044 |
| 2017 | $3,152 | $90,000 | $21,320 | $68,680 |
| 2016 | $5,708 | $126,000 | $15,300 | $110,700 |
| 2015 | $2,286 | $138,384 | $15,300 | $123,084 |
| 2014 | $2,289 | $138,384 | $15,300 | $123,084 |
| 2013 | -- | $144,436 | $15,300 | $129,136 |
Source: Public Records
Map
Nearby Homes
- 7172 Standing Boy Rd
- 1405 Big Eddy Ct
- 7349 Lullwater Rd
- 7209 Williams Hill Rd
- 4 Mountain Ridge Ct
- 1133 Standing Boy Ct
- 6758 Standing Boy Rd
- 5 Mountain Ridge Ct
- Lot 100 Rolling Bend Rd
- 7301 Grand View Rd
- 6227 Waterford Rd
- 7633 Grand Ridge Rd
- 6528 Standing Boy Rd
- 6861 Copper Oaks Ct
- 6801 River Rd Unit 406
- 6801 River Rd Unit 407
- 141 Willett Dr
- 6400 Green Island Dr Unit 42
- 6400 Green Island Dr Unit 11
- 6400 Green Island Dr Unit 43
- 7158 Standing Boy Rd
- 7146 Standing Boy Rd
- 7130 Leighton Rd
- 7141 Standing Boy Rd
- 7164 Standing Boy Rd
- 7140 Leighton Rd
- 7140 Standing Boy Rd
- 7161 Standing Boy Rd
- 7101 Lullwater Rd
- 7133 Leighton Rd
- 7114 Leighton Rd
- 7010 Mulford Ct
- 7146 Leighton Rd
- 7171 Standing Boy Rd
- 7109 Lullwater Rd
- 7014 Stone Ct
- 7153 Leighton Rd
- 7107 Leighton Rd
- 7176 Standing Boy Rd
- 7013 Stone Ct
Your Personal Tour Guide
Ask me questions while you tour the home.