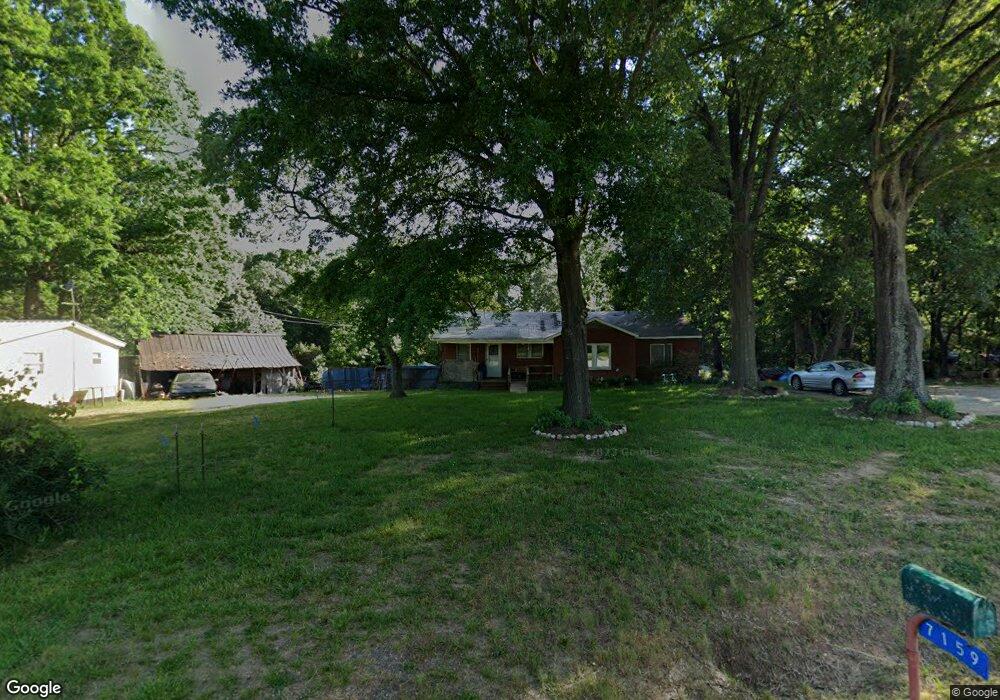
7159 Scout Rd Locust, NC 28097
Estimated Value: $276,432 - $348,000
3
Beds
2
Baths
1,490
Sq Ft
$213/Sq Ft
Est. Value
About This Home
This home is located at 7159 Scout Rd, Locust, NC 28097 and is currently estimated at $317,358, approximately $212 per square foot. 7159 Scout Rd is a home located in Stanly County with nearby schools including Locust Elementary School, West Stanly Middle School, and West Stanly High School.
Create a Home Valuation Report for This Property
The Home Valuation Report is an in-depth analysis detailing your home's value as well as a comparison with similar homes in the area
Home Values in the Area
Average Home Value in this Area
Tax History
| Year | Tax Paid | Tax Assessment Tax Assessment Total Assessment is a certain percentage of the fair market value that is determined by local assessors to be the total taxable value of land and additions on the property. | Land | Improvement |
|---|---|---|---|---|
| 2025 | $1,066 | $169,175 | $94,000 | $75,175 |
| 2024 | $3,279 | $113,982 | $56,500 | $57,482 |
| 2023 | $2,969 | $113,982 | $56,500 | $57,482 |
| 2022 | $821 | $113,982 | $56,500 | $57,482 |
| 2021 | $809 | $113,982 | $56,500 | $57,482 |
| 2020 | $762 | $99,996 | $48,000 | $51,996 |
| 2019 | $770 | $99,996 | $48,000 | $51,996 |
| 2018 | $104 | $99,996 | $48,000 | $51,996 |
| 2017 | $770 | $99,996 | $48,000 | $51,996 |
| 2016 | $715 | $92,860 | $41,500 | $51,360 |
| 2015 | $534 | $92,860 | $41,500 | $51,360 |
| 2014 | $554 | $92,860 | $41,500 | $51,360 |
Source: Public Records
Map
Nearby Homes
- 107 Oakgrove St
- 716 Saddlebred Ln
- 421 Carolina Hemlock Dr
- 206 Montclair Dr
- Lot 1 Meadow Creek Church Rd Unit 1
- 913 Meadow Creek Church Rd
- 202 Jenkins St
- 306 Old Hickory Rd
- 207 Kerri Dawn Ln
- 11812 Glenwood Dr
- 219 Kerri Dawn Ln
- 417 Kiser Ln
- 617 Ardsley Dr
- 11788 Glenwood Dr Unit 56
- 211 Drive Inn Rd
- 7158 Barleywood Dr
- 230 Battery Dr
- 166 Battery Dr
- 12155 Muscadine Ct
- 12160 Muscadine Ct
- 7179 Scout Rd
- 7139 Scout Rd
- 7187 Scout Rd
- 203 Oakgrove St
- 119 Oakgrove St
- 208 Oakgrove St
- 7190 Scout Rd
- 000 Lot 2B Scout Rd
- 115 Oakgrove St
- 7199 Scout Rd
- 000 Scout Rd Unit 2
- 000 Scout Rd
- 111 Oakgrove St
- 7124 Scout Rd
- 206 Oakgrove St
- 000 Lot 2 Scout Rd
- 118 Oakgrove St
- 7166 Scout Rd
- 114 Oakgrove St
- 212 Scout Rd
Your Personal Tour Guide
Ask me questions while you tour the home.