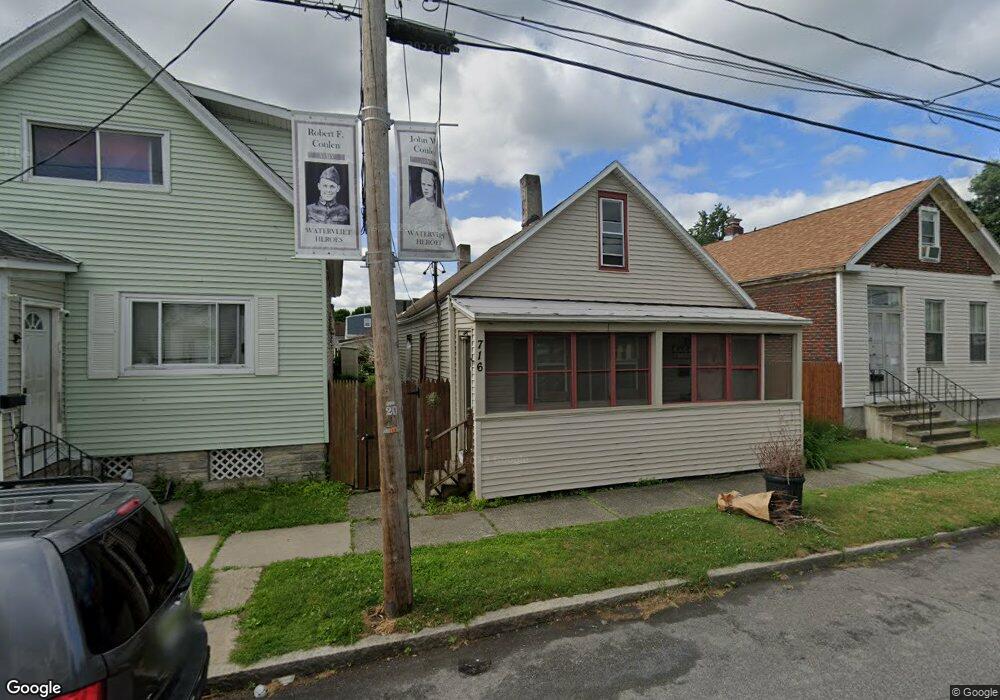
716 25th St Watervliet, NY 12189
Estimated Value: $175,000 - $205,959
3
Beds
1
Bath
1,300
Sq Ft
$145/Sq Ft
Est. Value
About This Home
This home is located at 716 25th St, Watervliet, NY 12189 and is currently estimated at $188,990, approximately $145 per square foot. 716 25th St is a home located in Albany County with nearby schools including Watervliet Elementary School, Watervliet Junior/Senior High School, and Redemption Christian Academy.
Ownership History
Date
Name
Owned For
Owner Type
Purchase Details
Closed on
Oct 19, 2006
Sold by
Belardo Vincent
Bought by
Dugan Thomas
Current Estimated Value
Home Financials for this Owner
Home Financials are based on the most recent Mortgage that was taken out on this home.
Original Mortgage
$80,000
Outstanding Balance
$47,341
Interest Rate
6.31%
Estimated Equity
$141,649
Purchase Details
Closed on
Mar 30, 2006
Sold by
Morrow John
Bought by
Belardo Vincent
Purchase Details
Closed on
Mar 16, 2006
Sold by
Cronin Ronald E
Bought by
Morrow John
Create a Home Valuation Report for This Property
The Home Valuation Report is an in-depth analysis detailing your home's value as well as a comparison with similar homes in the area
Home Values in the Area
Average Home Value in this Area
Purchase History
| Date | Buyer | Sale Price | Title Company |
|---|---|---|---|
| Dugan Thomas | $101,000 | -- | |
| Dugan Thomas G | $101,000 | Affirmative Title | |
| Belardo Vincent | $45,000 | Keith A Daniels | |
| Morrow John | $25,000 | Thomas E Lamb |
Source: Public Records
Mortgage History
| Date | Status | Borrower | Loan Amount |
|---|---|---|---|
| Open | Dugan Thomas G | $80,000 | |
| Closed | Dugan Thomas | $80,000 |
Source: Public Records
Tax History Compared to Growth
Tax History
| Year | Tax Paid | Tax Assessment Tax Assessment Total Assessment is a certain percentage of the fair market value that is determined by local assessors to be the total taxable value of land and additions on the property. | Land | Improvement |
|---|---|---|---|---|
| 2024 | $2,412 | $92,300 | $25,000 | $67,300 |
| 2023 | $2,388 | $92,300 | $25,000 | $67,300 |
| 2022 | $2,282 | $92,300 | $25,000 | $67,300 |
| 2021 | $2,755 | $92,300 | $25,000 | $67,300 |
| 2020 | $2,661 | $92,300 | $25,000 | $67,300 |
| 2019 | $2,863 | $92,300 | $25,000 | $67,300 |
| 2018 | $2,584 | $92,300 | $25,000 | $67,300 |
| 2017 | $2,151 | $92,300 | $25,000 | $67,300 |
| 2016 | $2,310 | $92,300 | $25,000 | $67,300 |
| 2015 | -- | $83,300 | $25,000 | $58,300 |
| 2014 | -- | $83,300 | $25,000 | $58,300 |
Source: Public Records
Map
Nearby Homes