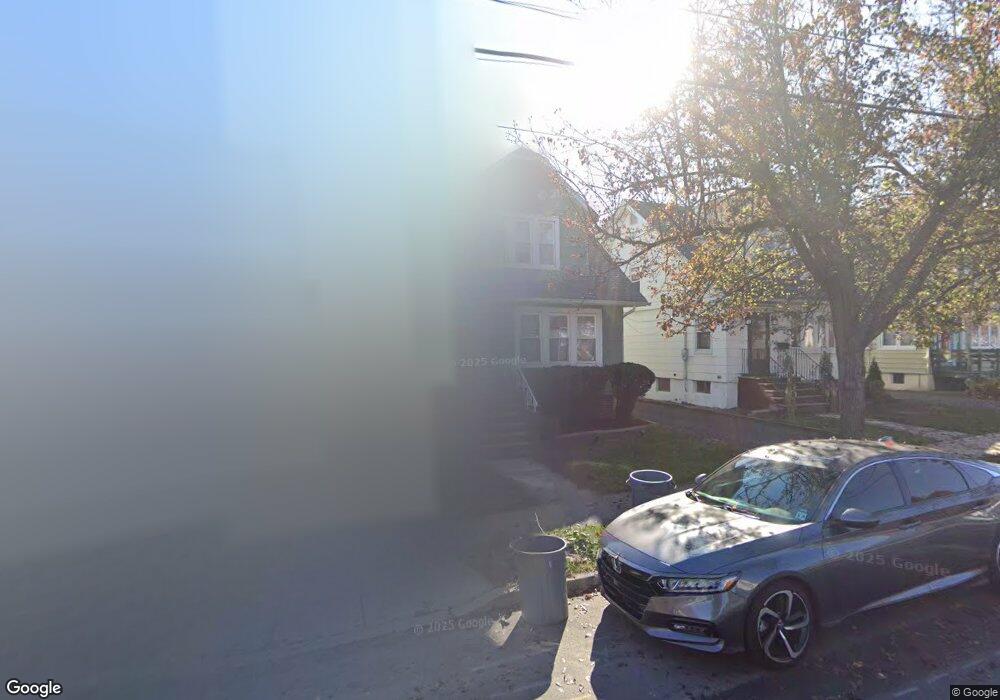
716 6th St Lyndhurst, NJ 07071
Estimated Value: $493,000 - $684,000
--
Bed
--
Bath
1,194
Sq Ft
$476/Sq Ft
Est. Value
About This Home
This home is located at 716 6th St, Lyndhurst, NJ 07071 and is currently estimated at $568,838, approximately $476 per square foot. 716 6th St is a home located in Bergen County with nearby schools including Lyndhurst High School and Sacred Heart School.
Ownership History
Date
Name
Owned For
Owner Type
Purchase Details
Closed on
May 17, 2023
Sold by
Ferrara Marc and Ferrara Jennifer
Bought by
Kodra-Ferrara Jennifer
Current Estimated Value
Purchase Details
Closed on
May 16, 2011
Sold by
Huryk Jacqueline
Bought by
Ferrars Marc and Kodra Ferrars Jennifer
Home Financials for this Owner
Home Financials are based on the most recent Mortgage that was taken out on this home.
Original Mortgage
$230,992
Interest Rate
4.75%
Mortgage Type
FHA
Create a Home Valuation Report for This Property
The Home Valuation Report is an in-depth analysis detailing your home's value as well as a comparison with similar homes in the area
Home Values in the Area
Average Home Value in this Area
Purchase History
| Date | Buyer | Sale Price | Title Company |
|---|---|---|---|
| Kodra-Ferrara Jennifer | -- | Cross County Title | |
| Kodra-Ferrara Jennifer | -- | Cross County Title | |
| Ferrars Marc | $237,000 | -- |
Source: Public Records
Mortgage History
| Date | Status | Borrower | Loan Amount |
|---|---|---|---|
| Previous Owner | Ferrars Marc | $230,992 |
Source: Public Records
Tax History Compared to Growth
Tax History
| Year | Tax Paid | Tax Assessment Tax Assessment Total Assessment is a certain percentage of the fair market value that is determined by local assessors to be the total taxable value of land and additions on the property. | Land | Improvement |
|---|---|---|---|---|
| 2025 | $9,297 | $454,400 | $301,400 | $153,000 |
| 2024 | $8,961 | $445,700 | $294,400 | $151,300 |
| 2023 | $7,311 | $441,000 | $291,400 | $149,600 |
| 2022 | $7,311 | $230,500 | $157,000 | $73,500 |
| 2021 | $7,007 | $230,500 | $157,000 | $73,500 |
| 2020 | $6,855 | $230,500 | $157,000 | $73,500 |
| 2019 | $6,804 | $230,500 | $157,000 | $73,500 |
| 2018 | $6,860 | $230,500 | $157,000 | $73,500 |
| 2017 | $6,687 | $230,500 | $157,000 | $73,500 |
| 2016 | $6,537 | $230,500 | $157,000 | $73,500 |
| 2015 | $6,332 | $230,500 | $157,000 | $73,500 |
| 2014 | $6,249 | $230,500 | $157,000 | $73,500 |
Source: Public Records
Map
Nearby Homes