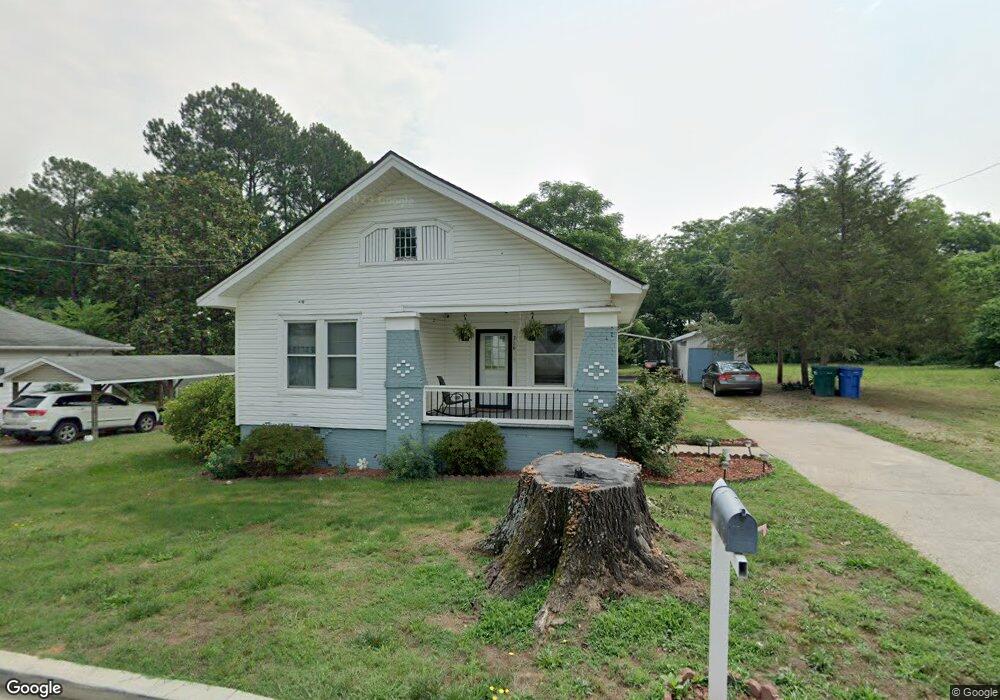
716 Austin St Albemarle, NC 28001
Estimated Value: $122,000 - $150,000
2
Beds
1
Bath
896
Sq Ft
$154/Sq Ft
Est. Value
About This Home
This home is located at 716 Austin St, Albemarle, NC 28001 and is currently estimated at $138,393, approximately $154 per square foot. 716 Austin St is a home located in Stanly County with nearby schools including Central Elementary School, Albemarle Middle School, and Albemarle High School.
Ownership History
Date
Name
Owned For
Owner Type
Purchase Details
Closed on
Jun 11, 2025
Sold by
Aparicio Edgar and Diaz Victoria
Bought by
Segovia Julio Cesar Diaz and De Diaz Rosa
Current Estimated Value
Purchase Details
Closed on
Feb 14, 2013
Sold by
Ayala Edgar Mauricio Aparicio and Alverez Victoria Esmeralda Diaz
Bought by
Ayala Edgar Mauricio Aparicio and Alverez Victoria Esmeralda Diaz
Purchase Details
Closed on
Jan 29, 2013
Sold by
Federal Home Loan Mortgage Corporation
Bought by
Aparicio Edgar and Diaz Victoria
Purchase Details
Closed on
Oct 9, 2012
Sold by
Mclendon Angela
Bought by
Federal Home Loan Mortgage Corporation
Purchase Details
Closed on
Apr 26, 2007
Sold by
Mills Roy C and Mills Judy C
Bought by
Mclendon Angela
Home Financials for this Owner
Home Financials are based on the most recent Mortgage that was taken out on this home.
Original Mortgage
$74,900
Interest Rate
6.1%
Mortgage Type
New Conventional
Create a Home Valuation Report for This Property
The Home Valuation Report is an in-depth analysis detailing your home's value as well as a comparison with similar homes in the area
Purchase History
| Date | Buyer | Sale Price | Title Company |
|---|---|---|---|
| Segovia Julio Cesar Diaz | -- | Chicago Title | |
| Ayala Edgar Mauricio Aparicio | -- | None Available | |
| Aparicio Edgar | -- | None Available | |
| Federal Home Loan Mortgage Corporation | $25,110 | None Available | |
| Mclendon Angela | $75,000 | None Available |
Source: Public Records
Mortgage History
| Date | Status | Borrower | Loan Amount |
|---|---|---|---|
| Previous Owner | Mclendon Angela | $74,900 |
Source: Public Records
Tax History
| Year | Tax Paid | Tax Assessment Tax Assessment Total Assessment is a certain percentage of the fair market value that is determined by local assessors to be the total taxable value of land and additions on the property. | Land | Improvement |
|---|---|---|---|---|
| 2025 | $820 | $73,232 | $14,701 | $58,531 |
| 2024 | $537 | $44,012 | $7,484 | $36,528 |
| 2023 | $537 | $44,012 | $7,484 | $36,528 |
| 2022 | $537 | $44,012 | $7,484 | $36,528 |
| 2021 | $537 | $44,012 | $7,484 | $36,528 |
| 2020 | $437 | $33,725 | $6,415 | $27,310 |
| 2019 | $442 | $33,725 | $6,415 | $27,310 |
| 2018 | $442 | $33,725 | $6,415 | $27,310 |
| 2017 | $425 | $33,725 | $6,415 | $27,310 |
| 2016 | $407 | $32,303 | $6,147 | $26,156 |
| 2015 | $411 | $32,303 | $6,147 | $26,156 |
| 2014 | $444 | $32,303 | $6,147 | $26,156 |
Source: Public Records
Map
Nearby Homes
- 722 Austin St
- 714 Wiscassett St
- 808 Long St Unit Lot 2
- 810 Long St
- 511 W Oakwood Ave
- 748 Efird St
- 923 Efird St Unit 97
- 823 Hill St
- 911 Hill St
- 000 Long St Unit 21,22,23,24
- 1206 Wiscassett St
- 928 Bost St
- 309 Love St
- 1229 Poplar St
- 1220 Wood St
- 211 Austin St
- 802 Lowder St
- 622 Watts St
- 610 Watts St
- 346 N Depot St
Your Personal Tour Guide
Ask me questions while you tour the home.