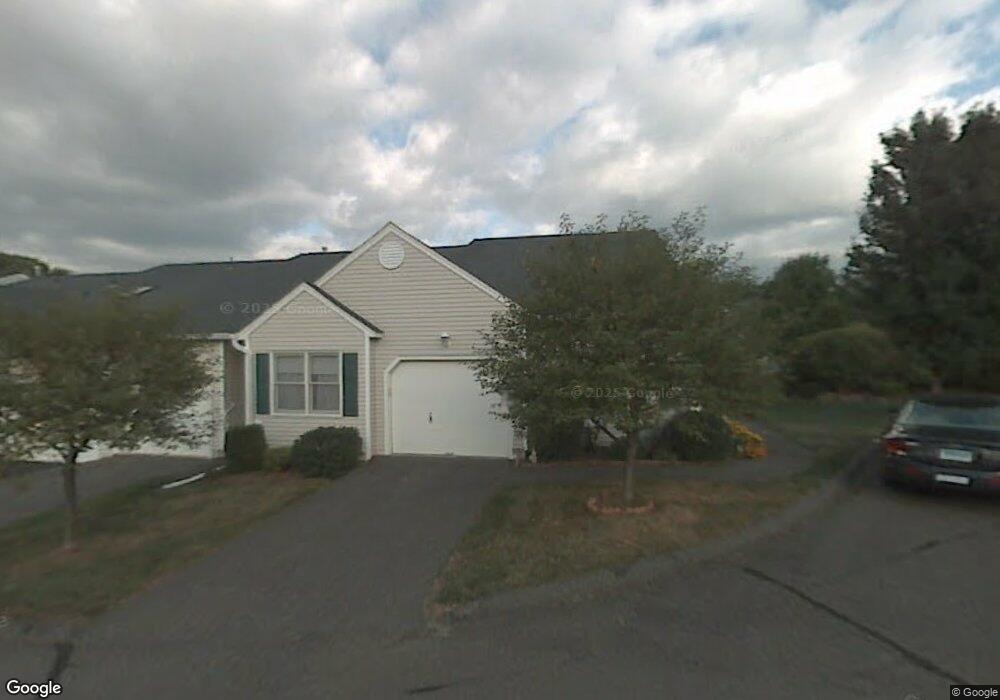
716 Berry Patch Way Unit 716 Southington, CT 06489
East Southington NeighborhoodEstimated Value: $315,326 - $352,000
2
Beds
2
Baths
1,133
Sq Ft
$296/Sq Ft
Est. Value
About This Home
This home is located at 716 Berry Patch Way Unit 716, Southington, CT 06489 and is currently estimated at $335,332, approximately $295 per square foot. 716 Berry Patch Way Unit 716 is a home located in Hartford County with nearby schools including Hatton Elementary School, Joseph A. Depaolo Middle School, and Southington High School.
Ownership History
Date
Name
Owned For
Owner Type
Purchase Details
Closed on
Aug 19, 2011
Sold by
Lazariel Elizabeth B
Bought by
Trenchard Patricia M
Current Estimated Value
Purchase Details
Closed on
Apr 8, 2005
Sold by
Damm Kathleen A and Raby Barbara Jean
Bought by
Lazariel Elizabeth B
Home Financials for this Owner
Home Financials are based on the most recent Mortgage that was taken out on this home.
Original Mortgage
$172,612
Interest Rate
5.7%
Purchase Details
Closed on
Jan 10, 1995
Sold by
Spring Lake Co
Bought by
Westermeyer Alfred and Westermeyer Barbara
Home Financials for this Owner
Home Financials are based on the most recent Mortgage that was taken out on this home.
Original Mortgage
$20,000
Interest Rate
6.5%
Create a Home Valuation Report for This Property
The Home Valuation Report is an in-depth analysis detailing your home's value as well as a comparison with similar homes in the area
Home Values in the Area
Average Home Value in this Area
Purchase History
| Date | Buyer | Sale Price | Title Company |
|---|---|---|---|
| Trenchard Patricia M | $185,000 | -- | |
| Lazariel Elizabeth B | $223,000 | -- | |
| Westermeyer Alfred | $130,187 | -- |
Source: Public Records
Mortgage History
| Date | Status | Borrower | Loan Amount |
|---|---|---|---|
| Open | Westermeyer Alfred | $60,000 | |
| Previous Owner | Westermeyer Alfred | $172,612 | |
| Previous Owner | Westermeyer Alfred | $20,000 |
Source: Public Records
Tax History
| Year | Tax Paid | Tax Assessment Tax Assessment Total Assessment is a certain percentage of the fair market value that is determined by local assessors to be the total taxable value of land and additions on the property. | Land | Improvement |
|---|---|---|---|---|
| 2025 | $4,997 | $150,470 | $0 | $150,470 |
| 2024 | $4,731 | $150,470 | $0 | $150,470 |
| 2023 | $4,568 | $150,470 | $0 | $150,470 |
| 2022 | $4,383 | $150,470 | $0 | $150,470 |
| 2021 | $4,368 | $150,470 | $0 | $150,470 |
| 2020 | $3,901 | $127,360 | $0 | $127,360 |
| 2019 | $3,902 | $127,360 | $0 | $127,360 |
| 2018 | $3,882 | $127,360 | $0 | $127,360 |
| 2017 | $3,882 | $127,360 | $0 | $127,360 |
| 2016 | $3,775 | $127,360 | $0 | $127,360 |
| 2015 | $3,598 | $123,480 | $0 | $123,480 |
| 2014 | $3,502 | $123,480 | $0 | $123,480 |
Source: Public Records
Map
Nearby Homes
- 621 Overlook Path
- 40 Hickory Hill
- 885 Glacier Way
- 1 Coach Dr Unit 1
- 872 Glacier Way Unit 872
- 41 Coach Dr Unit 41
- 6 Lakeview Dr
- 60 Marcy Dr
- 15 Woodruff St
- 67 Dogwood Dr
- 619 Woodruff St
- 184 Hobart St
- 100 Center St
- 775 Woodruff St
- 25 Whippoorwill Rd
- 166 Sun Valley Dr
- 500 Darling St Unit 12J
- 491 Main St
- 76 Kane St
- 160 Flanders Rd
- 716 Berry Patch Way
- 715 Berry Patch Way
- 714 Berry Patch Way
- 682 Ledgeview Ct
- 713 Berry Patch Way
- 713 Berry Patch Way Unit 713
- 721 Berry Patch Way
- 672 Ledgeview Ct
- 672 Ledgeview Ct Unit 672
- 722 Berry Patch Way
- 722 Berry Patch Way Unit 722
- 712 Berry Patch Way
- 712 Berry Patch Way Unit 712
- 684 Ledgeview Ct
- 683 Ledgeview Ct
- 711 Berry Patch Way
- 711 Berry Patch Way Unit 711
- 747 Berry Patch Way
- 747 Berry Patch Way Unit 747
Your Personal Tour Guide
Ask me questions while you tour the home.