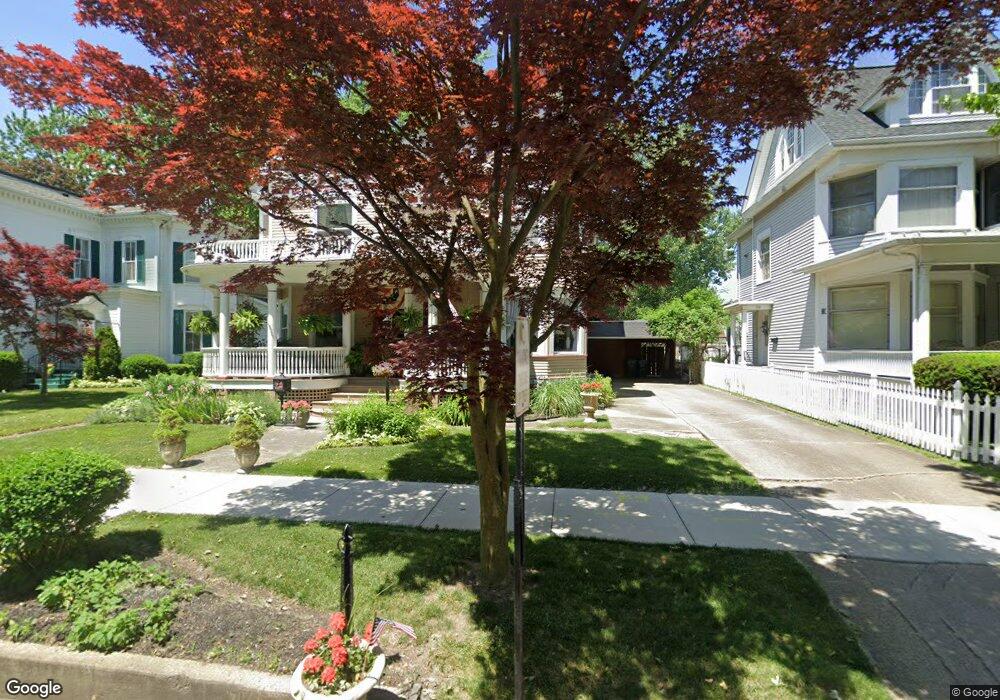
716 Birchard Ave Fremont, OH 43420
Estimated Value: $209,000 - $327,000
4
Beds
2
Baths
2,848
Sq Ft
$88/Sq Ft
Est. Value
About This Home
This home is located at 716 Birchard Ave, Fremont, OH 43420 and is currently estimated at $249,347, approximately $87 per square foot. 716 Birchard Ave is a home located in Sandusky County with nearby schools including Fremont Ross High School, Bishop Hoffman Catholic School - This is St Joe's School now, and St. Joseph School.
Ownership History
Date
Name
Owned For
Owner Type
Purchase Details
Closed on
Dec 31, 2003
Sold by
Sharp Michael C and Sharp Bobbie D
Bought by
Fiegl Christopher P
Current Estimated Value
Home Financials for this Owner
Home Financials are based on the most recent Mortgage that was taken out on this home.
Original Mortgage
$125,550
Outstanding Balance
$60,136
Interest Rate
6.25%
Mortgage Type
Purchase Money Mortgage
Estimated Equity
$189,211
Purchase Details
Closed on
Jun 23, 1998
Sold by
Davis Ronald E
Bought by
Sharp Michael C and Sharp Bobbie D
Home Financials for this Owner
Home Financials are based on the most recent Mortgage that was taken out on this home.
Original Mortgage
$115,900
Interest Rate
7.22%
Mortgage Type
New Conventional
Purchase Details
Closed on
Jun 17, 1996
Sold by
Chaney Douglas L
Bought by
Davis Ronald E and Davis Kathy A
Purchase Details
Closed on
Dec 16, 1994
Sold by
Vaffis Doris
Bought by
Chaney Douglas L and Chaney Harriet L
Home Financials for this Owner
Home Financials are based on the most recent Mortgage that was taken out on this home.
Original Mortgage
$90,700
Interest Rate
9.06%
Mortgage Type
New Conventional
Create a Home Valuation Report for This Property
The Home Valuation Report is an in-depth analysis detailing your home's value as well as a comparison with similar homes in the area
Home Values in the Area
Average Home Value in this Area
Purchase History
| Date | Buyer | Sale Price | Title Company |
|---|---|---|---|
| Fiegl Christopher P | $104,625 | Culbert Title Agency | |
| Sharp Michael C | $122,000 | -- | |
| Davis Ronald E | $122,000 | -- | |
| Chaney Douglas L | $95,500 | -- |
Source: Public Records
Mortgage History
| Date | Status | Borrower | Loan Amount |
|---|---|---|---|
| Open | Fiegl Christopher P | $125,550 | |
| Previous Owner | Sharp Michael C | $115,900 | |
| Previous Owner | Chaney Douglas L | $90,700 |
Source: Public Records
Tax History Compared to Growth
Tax History
| Year | Tax Paid | Tax Assessment Tax Assessment Total Assessment is a certain percentage of the fair market value that is determined by local assessors to be the total taxable value of land and additions on the property. | Land | Improvement |
|---|---|---|---|---|
| 2024 | $2,952 | $80,190 | $9,310 | $70,880 |
| 2023 | $2,952 | $63,640 | $7,390 | $56,250 |
| 2022 | $2,462 | $63,640 | $7,390 | $56,250 |
| 2021 | $2,542 | $63,640 | $7,390 | $56,250 |
| 2020 | $2,133 | $52,610 | $7,390 | $45,220 |
| 2019 | $2,130 | $52,610 | $7,390 | $45,220 |
| 2018 | $2,094 | $52,610 | $7,390 | $45,220 |
| 2017 | $2,053 | $50,440 | $7,390 | $43,050 |
| 2016 | $1,800 | $50,440 | $7,390 | $43,050 |
| 2015 | $1,770 | $50,440 | $7,390 | $43,050 |
| 2014 | $1,905 | $51,770 | $7,390 | $44,380 |
| 2013 | $2,152 | $51,770 | $7,390 | $44,380 |
Source: Public Records
Map
Nearby Homes
- 619 Hayes Ave
- 1037 Buckland Ave
- 1009 Napoleon St
- 1015 Hayes Ave
- 515 S Arch St
- 427 N Clover St
- 616 S Wood St
- 815 South St
- 501 Jackson St Unit 50
- 516 N Front St
- 208 E State St
- 1342 Mcpherson Blvd
- 625 Bush Place
- 1028 June St
- 224 Sandusky Ave Unit 226
- 1611 Mcpherson Blvd
- 340 340 Sandusky Ave
- 905 Twinn St
- 1013 Whittlesey St
- 711 Rawson Ave
- 710 Birchard Ave Unit 712
- 722 Birchard Ave
- 215 S Wood St
- 708 Birchard Ave
- 211 S Wood St
- 704 Birchard Ave
- 700 Birchard Ave
- 719 Birchard Ave Unit 1.2
- 719 Birchard Ave
- 800 Birchard Ave
- 212 S Wood St
- 719 Garrison St
- 717 Garrison St
- 719 721 Birchard Ave
- 711 Birchard Ave
- 210 S Wood St
- 707 Birchard Ave
- 705 Birchard Ave
- 711 Garrison St
- 309 S Wood St Unit 309