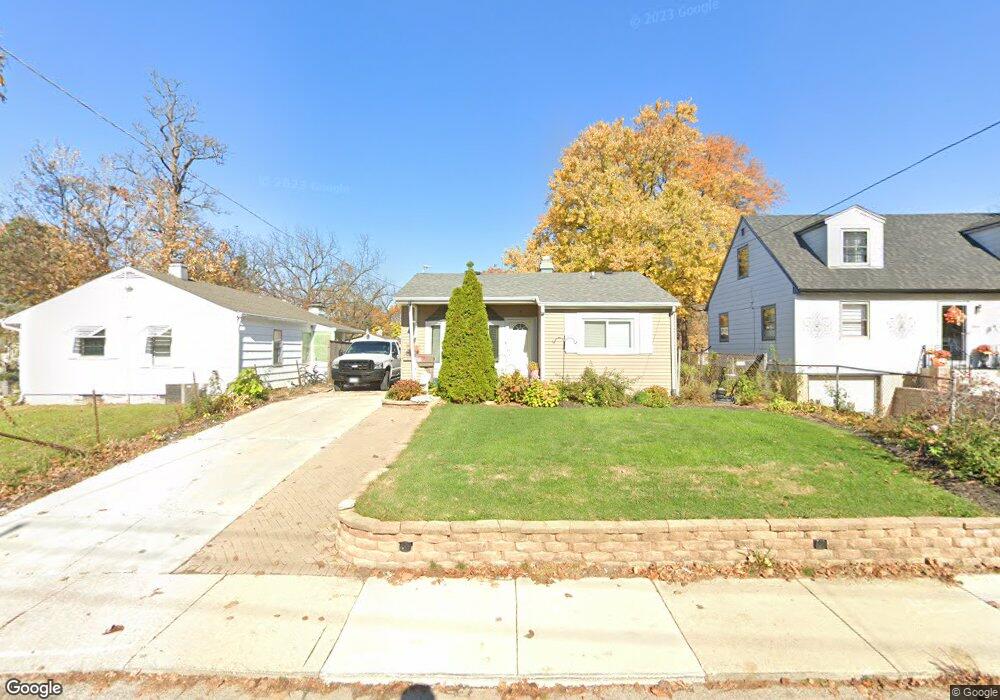
716 Buckeye St Elgin, IL 60123
Grant Park NeighborhoodEstimated Value: $241,000 - $257,000
2
Beds
2
Baths
920
Sq Ft
$273/Sq Ft
Est. Value
About This Home
This home is located at 716 Buckeye St, Elgin, IL 60123 and is currently estimated at $251,304, approximately $273 per square foot. 716 Buckeye St is a home located in Kane County with nearby schools including Highland Elementary School, Kimball Middle School, and Larkin High School.
Ownership History
Date
Name
Owned For
Owner Type
Purchase Details
Closed on
Mar 30, 2010
Sold by
The Bank Of New York Mellon Trust Compan
Bought by
Patinio Vargas Maria E
Current Estimated Value
Purchase Details
Closed on
Feb 1, 2010
Sold by
Guerrero Florencio
Bought by
The Bank Of New York Mellon Trust Compan
Purchase Details
Closed on
Dec 4, 2000
Sold by
Gavina Rodolfo and Gavina Marta
Bought by
Guerrero Florencio and Guerrero Altagracia
Home Financials for this Owner
Home Financials are based on the most recent Mortgage that was taken out on this home.
Original Mortgage
$97,600
Interest Rate
7.7%
Purchase Details
Closed on
Aug 16, 1999
Sold by
Brewington Vivian
Bought by
Gavina Rodolfo and Gavina Marta
Home Financials for this Owner
Home Financials are based on the most recent Mortgage that was taken out on this home.
Original Mortgage
$99,000
Interest Rate
7.7%
Create a Home Valuation Report for This Property
The Home Valuation Report is an in-depth analysis detailing your home's value as well as a comparison with similar homes in the area
Home Values in the Area
Average Home Value in this Area
Purchase History
| Date | Buyer | Sale Price | Title Company |
|---|---|---|---|
| Patinio Vargas Maria E | $60,000 | Wheatland Title Guaranty | |
| The Bank Of New York Mellon Trust Compan | -- | None Available | |
| Guerrero Florencio | $122,000 | Chicago Title Insurance Co | |
| Gavina Rodolfo | $110,000 | Greater Illinois Title Compa |
Source: Public Records
Mortgage History
| Date | Status | Borrower | Loan Amount |
|---|---|---|---|
| Previous Owner | Guerrero Florencio | $97,600 | |
| Previous Owner | Gavina Rodolfo | $99,000 |
Source: Public Records
Tax History Compared to Growth
Tax History
| Year | Tax Paid | Tax Assessment Tax Assessment Total Assessment is a certain percentage of the fair market value that is determined by local assessors to be the total taxable value of land and additions on the property. | Land | Improvement |
|---|---|---|---|---|
| 2024 | $5,451 | $68,118 | $13,160 | $54,958 |
| 2023 | $5,246 | $61,539 | $11,889 | $49,650 |
| 2022 | $4,866 | $56,113 | $10,841 | $45,272 |
| 2021 | $4,681 | $52,462 | $10,136 | $42,326 |
| 2020 | $4,568 | $50,083 | $9,676 | $40,407 |
| 2019 | $4,456 | $47,707 | $9,217 | $38,490 |
| 2018 | $4,063 | $41,092 | $8,683 | $32,409 |
| 2017 | $3,996 | $38,847 | $8,209 | $30,638 |
| 2016 | $3,844 | $36,040 | $7,616 | $28,424 |
| 2015 | -- | $33,034 | $6,981 | $26,053 |
| 2014 | -- | $32,626 | $6,895 | $25,731 |
| 2013 | -- | $37,011 | $7,077 | $29,934 |
Source: Public Records
Map
Nearby Homes
- 558 N Crystal St
- 518 Clark St
- 431 N Crystal St
- 3 Garden Crescent Ct
- 54 Genesee Ave
- 334 N Crystal St
- LOTS 14 & 15 Teal Ave
- LOT 17 Teal Ave
- 315 N Commonwealth Ave
- 426 N Grove Ave
- 340 Hubbard Ave
- 587 N Clifton Ave
- 71 Lovell St
- Lot N Alfred Ave
- 1103 Lawrence Ave
- 638 N Spring St
- 200 Jefferson Ave
- 712 W Highland Ave Unit 4
- 308 N Clifton Ave
- 120 Kimball St
- 601 Mcclure Ave
- 712 Buckeye St
- 715 Schiller St
- 617 Mcclure Ave
- 593 Mcclure Ave
- 750 Buckeye St
- 610 Mcclure Ave
- 709 Buckeye St
- 612 Mcclure Ave
- 575 Mcclure Ave
- 703 Buckeye St
- 755 Buckeye St
- 620 Mcclure Ave
- 653 Mcclure Ave
- 571 Mcclure Ave
- 764 Buckeye St
- 576 Mcclure Ave
- 652 N Crystal St
- 580 N Crystal St
- 765 Schiller St