Estimated Value: $200,813 - $297,000
2
Beds
2
Baths
1,450
Sq Ft
$171/Sq Ft
Est. Value
About This Home
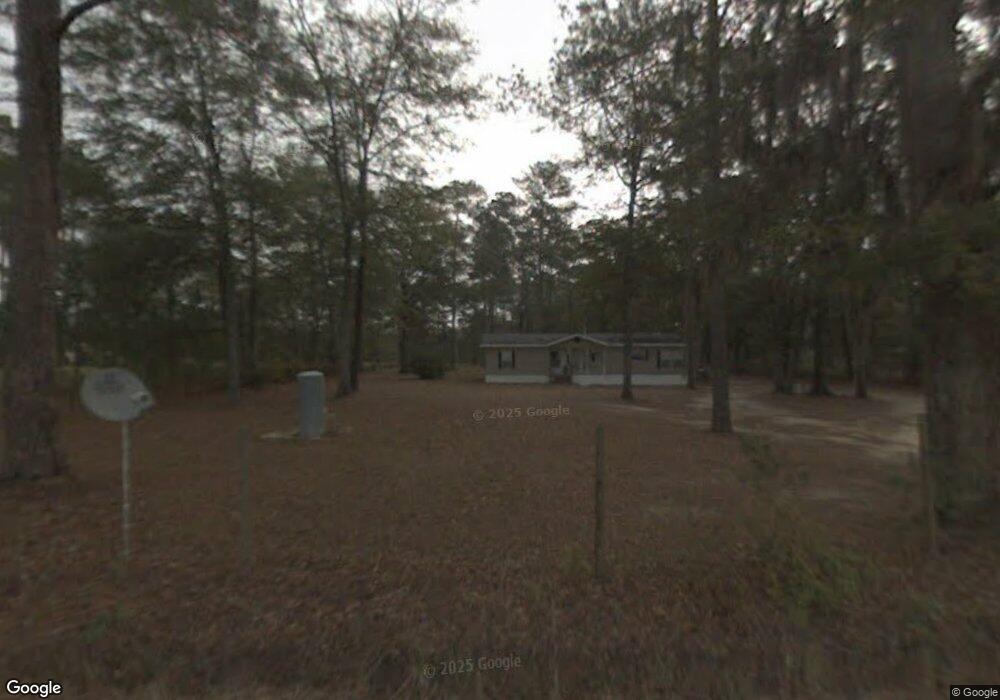
This home is located at 716 Capel Rd, Cairo, GA 39827 and is currently estimated at $247,703, approximately $170 per square foot. 716 Capel Rd is a home.
Ownership History
Date
Name
Owned For
Owner Type
Purchase Details
Closed on
Jan 23, 2019
Sold by
Harrison Coleman C
Bought by
Lofley Hinson C and Fowler Russell A
Current Estimated Value
Purchase Details
Closed on
Dec 3, 2015
Sold by
Miller Dewitt Anthony
Bought by
Fowler John R and Fowler Russell A
Purchase Details
Closed on
Mar 22, 2004
Bought by
Miller Dewitt Anthony
Purchase Details
Closed on
Feb 5, 1996
Sold by
Johnson V Scott
Bought by
Johnson Donna M
Purchase Details
Closed on
Mar 6, 1995
Sold by
Johnson Barbara K
Bought by
Johnson V Scott
Purchase Details
Closed on
Aug 20, 1993
Bought by
Johnson Barbara K
Create a Home Valuation Report for This Property
The Home Valuation Report is an in-depth analysis detailing your home's value as well as a comparison with similar homes in the area
Purchase History
| Date | Buyer | Sale Price | Title Company |
|---|---|---|---|
| Lofley Hinson C | -- | -- | |
| Fowler John R | $7,000 | -- | |
| Miller Dewitt Anthony | $30,000 | -- | |
| Johnson Donna M | $13,000 | -- | |
| Johnson V Scott | $11,000 | -- | |
| Johnson Barbara K | $11,000 | -- |
Source: Public Records
Tax History
| Year | Tax Paid | Tax Assessment Tax Assessment Total Assessment is a certain percentage of the fair market value that is determined by local assessors to be the total taxable value of land and additions on the property. | Land | Improvement |
|---|---|---|---|---|
| 2024 | $1,874 | $61,948 | $3,111 | $58,837 |
| 2023 | $1,120 | $36,394 | $1,944 | $34,450 |
| 2022 | $1,120 | $36,394 | $1,944 | $34,450 |
| 2021 | $1,124 | $36,394 | $1,944 | $34,450 |
| 2020 | $1,128 | $36,394 | $1,944 | $34,450 |
| 2019 | $725 | $23,388 | $1,944 | $21,444 |
| 2018 | $680 | $23,388 | $1,944 | $21,444 |
| 2017 | $648 | $23,388 | $1,944 | $21,444 |
| 2016 | $78 | $3,944 | $1,944 | $2,000 |
| 2015 | $109 | $3,944 | $1,944 | $2,000 |
| 2014 | -- | $3,944 | $1,944 | $2,000 |
| 2013 | -- | $4,520 | $2,520 | $2,000 |
Source: Public Records
Map
Nearby Homes
Your Personal Tour Guide
Ask me questions while you tour the home.