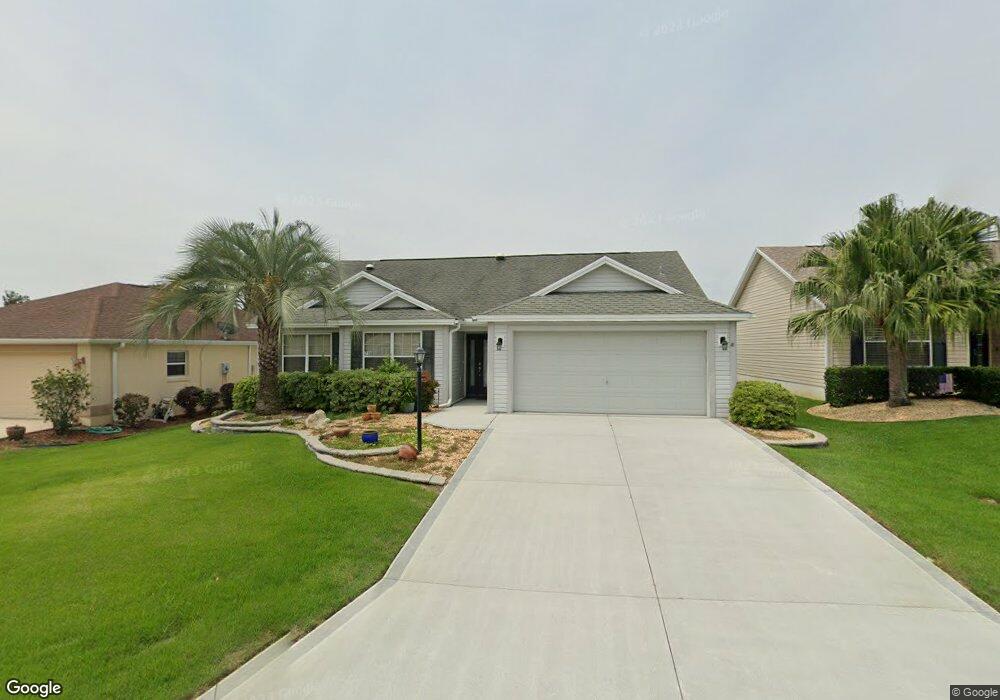
716 Chapman Loop The Villages, FL 32162
Village of Hemingway NeighborhoodEstimated Value: $379,903 - $436,000
3
Beds
2
Baths
2,324
Sq Ft
$175/Sq Ft
Est. Value
About This Home
This home is located at 716 Chapman Loop, The Villages, FL 32162 and is currently estimated at $405,726, approximately $174 per square foot. 716 Chapman Loop is a home located in Sumter County.
Ownership History
Date
Name
Owned For
Owner Type
Purchase Details
Closed on
Mar 11, 2021
Sold by
Urban Howard P and Howard P Urban Sr Revocable Tr
Bought by
Fabian Karen J and Caramore Thomas J
Current Estimated Value
Home Financials for this Owner
Home Financials are based on the most recent Mortgage that was taken out on this home.
Original Mortgage
$203,000
Outstanding Balance
$165,016
Interest Rate
2.73%
Mortgage Type
New Conventional
Estimated Equity
$240,710
Purchase Details
Closed on
Jan 21, 2019
Sold by
Urban Howard P and Urban Howard P
Bought by
Urban Howard P and Howard P Urban Sr Revocable Tr
Purchase Details
Closed on
Aug 28, 2018
Sold by
Patalak Kimberly Jean and The Dawn Lea Patalak Living Tr
Bought by
Urban Howard P
Purchase Details
Closed on
Jun 16, 2011
Sold by
Patalak Dawn L
Bought by
Patalak Dawn L
Purchase Details
Closed on
Sep 3, 2010
Sold by
Kurtz Barry L
Bought by
Patalak Dawn L
Create a Home Valuation Report for This Property
The Home Valuation Report is an in-depth analysis detailing your home's value as well as a comparison with similar homes in the area
Home Values in the Area
Average Home Value in this Area
Purchase History
| Date | Buyer | Sale Price | Title Company |
|---|---|---|---|
| Fabian Karen J | $314,500 | Peninsula Land & Title | |
| Urban Howard P | -- | Attorney | |
| Urban Howard P | $272,500 | Peninsula Land & Title | |
| Patalak Dawn L | -- | Attorney | |
| Patalak Dawn L | $205,000 | Tri County Land Title & Escr |
Source: Public Records
Mortgage History
| Date | Status | Borrower | Loan Amount |
|---|---|---|---|
| Open | Fabian Karen J | $203,000 |
Source: Public Records
Tax History
| Year | Tax Paid | Tax Assessment Tax Assessment Total Assessment is a certain percentage of the fair market value that is determined by local assessors to be the total taxable value of land and additions on the property. | Land | Improvement |
|---|---|---|---|---|
| 2025 | $4,070 | $313,250 | $32,760 | $280,490 |
| 2024 | $5,248 | $318,370 | $32,760 | $285,610 |
| 2023 | $5,248 | $323,370 | $21,840 | $301,530 |
| 2022 | $5,018 | $306,850 | $21,790 | $285,060 |
| 2021 | $4,585 | $238,380 | $21,790 | $216,590 |
| 2020 | $4,772 | $243,640 | $16,380 | $227,260 |
| 2019 | $4,723 | $232,350 | $16,380 | $215,970 |
| 2018 | $3,365 | $174,010 | $0 | $0 |
| 2017 | $3,379 | $170,440 | $0 | $0 |
| 2016 | $3,239 | $166,940 | $0 | $0 |
| 2015 | $3,339 | $165,780 | $0 | $0 |
| 2014 | $3,481 | $164,470 | $0 | $0 |
Source: Public Records
Map
Nearby Homes
- 2530 Saffron Ln
- 915 Chapman Loop
- 2679 Lantana Ave
- 2440 Iverson Ct
- 2569 Errol Terrace
- 1001 Greyford Ln
- 986 Oscar Ln
- 1004 Davit Place
- 995 Joiner Place
- 2377 Longbow Trail
- 2320 Notch Ave
- 1089 Berg Ct
- 752 Baisley Trail
- 439 Grovewood Place
- 701 Cordova Cir
- 2505 Heath Springs Dr
- 2157 Blackville Dr
- 2912 Asher Path
- 1069 Burnettown Place
- 841 Yemassee Loop Unit 122
- 720 Chapman Loop
- 712 Chapman Loop
- 759 Bartlet Ln
- 753 Bartlet Ln
- 765 Bartlet Ln
- 724 Chapman Loop
- 708 Chapman Loop
- 747 Bartlet Ln
- 715 Chapman Loop
- 719 Chapman Loop
- 771 Bartlet Ln
- 711 Chapman Loop
- 728 Chapman Loop
- 723 Chapman Loop
- 777 Bartlet Ln
- 758 Bartlet Ln
- 752 Bartlet Ln
- 730 Chapman Loop
- 707 Chapman Loop
- 727 Chapman Loop
Your Personal Tour Guide
Ask me questions while you tour the home.