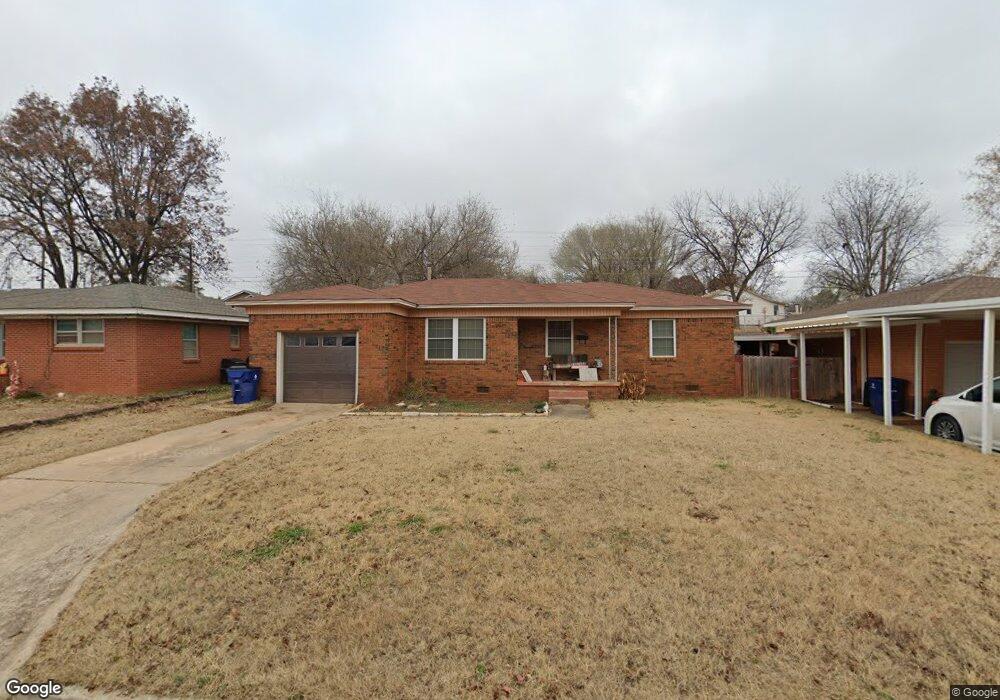
716 Cinmac St Lindsay, OK 73052
Estimated Value: $94,219 - $111,000
2
Beds
1
Bath
1,004
Sq Ft
$102/Sq Ft
Est. Value
About This Home
This home is located at 716 Cinmac St, Lindsay, OK 73052 and is currently estimated at $102,805, approximately $102 per square foot. 716 Cinmac St is a home located in Garvin County with nearby schools including Lindsay Elementary School, Lindsay Middle School, and Lindsay High School.
Ownership History
Date
Name
Owned For
Owner Type
Purchase Details
Closed on
Jul 12, 2013
Sold by
Haire Christopher C and Haire Lynsey R
Bought by
Goyne Mary Dawn
Current Estimated Value
Home Financials for this Owner
Home Financials are based on the most recent Mortgage that was taken out on this home.
Original Mortgage
$62,245
Outstanding Balance
$45,006
Interest Rate
3.94%
Mortgage Type
New Conventional
Estimated Equity
$57,799
Purchase Details
Closed on
Jan 12, 2009
Sold by
Watts Detrick E and Watts Natasha C
Bought by
Haire Christopher C and Haire Lynsey R
Home Financials for this Owner
Home Financials are based on the most recent Mortgage that was taken out on this home.
Original Mortgage
$59,218
Interest Rate
5.48%
Mortgage Type
FHA
Purchase Details
Closed on
Dec 28, 2003
Sold by
Vaught Wm L and Vaught Janet
Bought by
Watts Detrick and Watts Natasha
Purchase Details
Closed on
Sep 22, 2003
Sold by
Vaught Wm and Vaught Thelma
Bought by
Vaught Wm Lyndel
Create a Home Valuation Report for This Property
The Home Valuation Report is an in-depth analysis detailing your home's value as well as a comparison with similar homes in the area
Home Values in the Area
Average Home Value in this Area
Purchase History
| Date | Buyer | Sale Price | Title Company |
|---|---|---|---|
| Goyne Mary Dawn | $61,000 | None Available | |
| Haire Christopher C | $60,000 | None Available | |
| Watts Detrick | $46,500 | -- | |
| Vaught Wm Lyndel | -- | -- |
Source: Public Records
Mortgage History
| Date | Status | Borrower | Loan Amount |
|---|---|---|---|
| Open | Goyne Mary Dawn | $62,245 | |
| Previous Owner | Haire Christopher C | $59,218 |
Source: Public Records
Tax History
| Year | Tax Paid | Tax Assessment Tax Assessment Total Assessment is a certain percentage of the fair market value that is determined by local assessors to be the total taxable value of land and additions on the property. | Land | Improvement |
|---|---|---|---|---|
| 2025 | $574 | $8,004 | $458 | $7,546 |
| 2024 | $606 | $7,770 | $458 | $7,312 |
| 2023 | $556 | $7,544 | $458 | $7,086 |
| 2022 | $574 | $7,522 | $458 | $7,064 |
| 2021 | $578 | $7,493 | $458 | $7,035 |
| 2020 | $543 | $7,303 | $458 | $6,845 |
| 2019 | $522 | $7,090 | $458 | $6,632 |
| 2018 | $510 | $6,883 | $458 | $6,425 |
| 2017 | $500 | $6,683 | $458 | $6,225 |
| 2016 | $516 | $6,944 | $327 | $6,617 |
| 2015 | $475 | $6,754 | $327 | $6,427 |
| 2014 | $488 | $6,840 | $327 | $6,513 |
Source: Public Records
Map
Nearby Homes
- 711 Cinmac St
- 1101 NW 7th St
- 422 Northcutt Dr
- 501 Smith Cir
- 418 Garrett Ave
- 409 Olive Blvd
- 406 Winona Blvd
- 1212 Lynnwood Dr
- 16397 County Rd
- 924 W Cherokee Place
- 610 W Choctaw St
- 1009 W Cherokee Place
- 405 W Choctaw St
- 311 NE 3rd St
- 210 W Choctaw St
- 0 Oklahoma 19
- 929 Creek
- 301 W Chickasaw St
- 410 W Creek St
- 410 W Comanche St
Your Personal Tour Guide
Ask me questions while you tour the home.