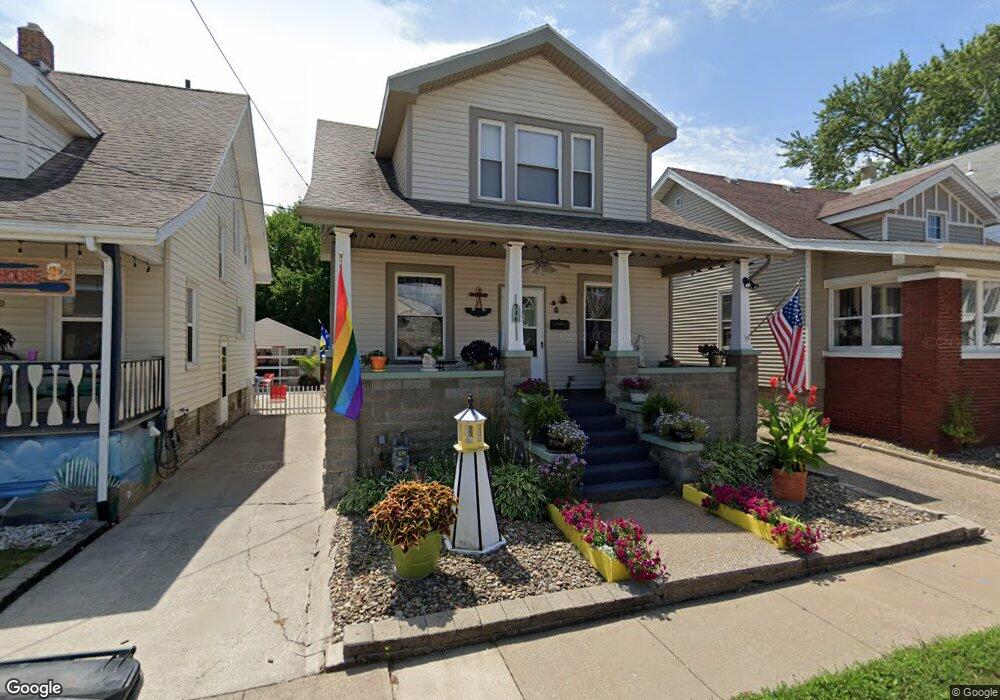
716 Curran St Sandusky, OH 44870
Estimated Value: $110,000 - $155,318
3
Beds
1
Bath
1,440
Sq Ft
$91/Sq Ft
Est. Value
About This Home
This home is located at 716 Curran St, Sandusky, OH 44870 and is currently estimated at $130,330, approximately $90 per square foot. 716 Curran St is a home located in Erie County with nearby schools including Sandusky High School, Monroe Preparatory Academy, and Sandusky Central Catholic School.
Ownership History
Date
Name
Owned For
Owner Type
Purchase Details
Closed on
Oct 17, 2023
Sold by
Riggle Bradley R
Bought by
Arnold Nathan
Current Estimated Value
Purchase Details
Closed on
Jan 29, 1997
Sold by
Glen Decker Realty Inc
Bought by
Riggle Bradley R
Home Financials for this Owner
Home Financials are based on the most recent Mortgage that was taken out on this home.
Original Mortgage
$47,400
Interest Rate
7.81%
Mortgage Type
New Conventional
Purchase Details
Closed on
Aug 13, 1996
Sold by
Whitstone Robert A
Bought by
Glen Decker Realty Inc
Create a Home Valuation Report for This Property
The Home Valuation Report is an in-depth analysis detailing your home's value as well as a comparison with similar homes in the area
Home Values in the Area
Average Home Value in this Area
Purchase History
| Date | Buyer | Sale Price | Title Company |
|---|---|---|---|
| Arnold Nathan | $115,620 | Southern Title | |
| Riggle Bradley R | $50,000 | -- | |
| Glen Decker Realty Inc | $49,900 | -- |
Source: Public Records
Mortgage History
| Date | Status | Borrower | Loan Amount |
|---|---|---|---|
| Previous Owner | Riggle Bradley R | $47,400 |
Source: Public Records
Tax History Compared to Growth
Tax History
| Year | Tax Paid | Tax Assessment Tax Assessment Total Assessment is a certain percentage of the fair market value that is determined by local assessors to be the total taxable value of land and additions on the property. | Land | Improvement |
|---|---|---|---|---|
| 2024 | $1,425 | $36,183 | $2,240 | $33,943 |
| 2023 | $1,425 | $20,037 | $1,757 | $18,280 |
| 2022 | $1,043 | $20,034 | $1,757 | $18,277 |
| 2021 | $1,002 | $20,040 | $1,760 | $18,280 |
| 2020 | $991 | $18,210 | $1,760 | $16,450 |
| 2019 | $1,019 | $18,210 | $1,760 | $16,450 |
| 2018 | $1,021 | $18,210 | $1,760 | $16,450 |
| 2017 | $1,187 | $21,130 | $2,290 | $18,840 |
| 2016 | $1,186 | $21,130 | $2,290 | $18,840 |
| 2015 | $1,071 | $21,130 | $2,290 | $18,840 |
| 2014 | $1,065 | $21,130 | $2,290 | $18,840 |
| 2013 | $1,045 | $20,960 | $2,290 | $18,670 |
Source: Public Records
Map
Nearby Homes