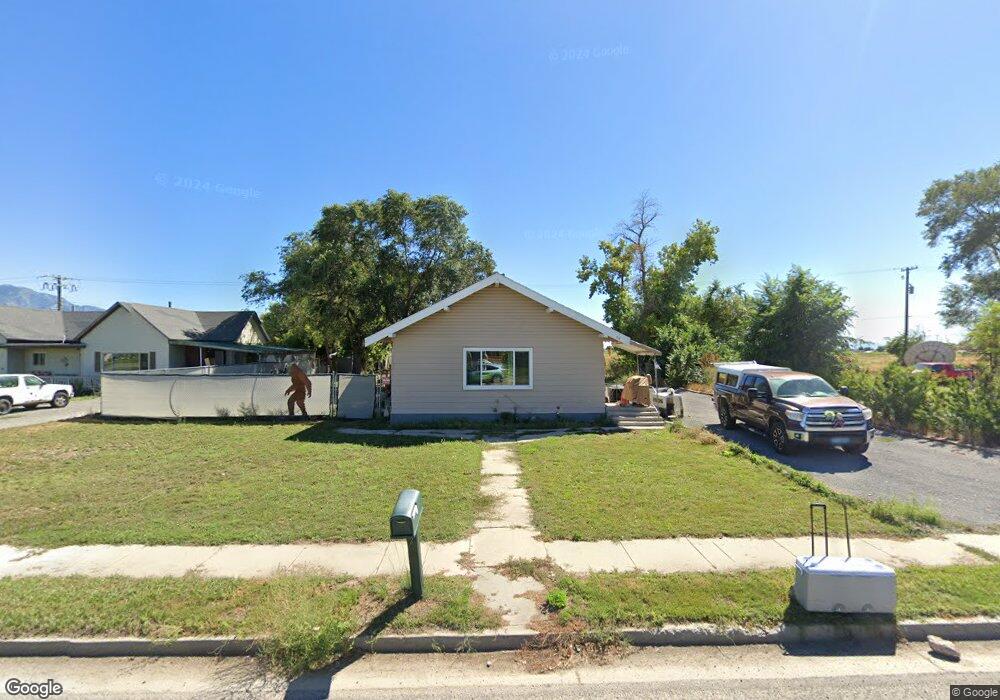
716 E Factory St Garland, UT 84312
Estimated Value: $312,000 - $354,377
3
Beds
1
Bath
1,402
Sq Ft
$238/Sq Ft
Est. Value
About This Home
This home is located at 716 E Factory St, Garland, UT 84312 and is currently estimated at $333,844, approximately $238 per square foot. 716 E Factory St is a home located in Box Elder County with nearby schools including Garland School, Bear River Middle School, and Alice C. Harris Intermediate School.
Ownership History
Date
Name
Owned For
Owner Type
Purchase Details
Closed on
Apr 28, 2022
Sold by
Milner Tarran T
Bought by
Bott Danielle and Wright Clayton
Current Estimated Value
Home Financials for this Owner
Home Financials are based on the most recent Mortgage that was taken out on this home.
Original Mortgage
$17,438
Outstanding Balance
$16,494
Interest Rate
5.1%
Estimated Equity
$317,350
Purchase Details
Closed on
Jan 20, 2015
Sold by
Hulse Johnny
Bought by
Milner Tarran T and Kenison Tiffani A
Purchase Details
Closed on
Jun 19, 2014
Sold by
Jpmorgan Chase Bank N A
Bought by
Hulse Johnny
Purchase Details
Closed on
Mar 4, 2014
Sold by
Ford Jeremy W
Bought by
Jpmorgan Chase Bank Na
Purchase Details
Closed on
Jan 4, 2013
Sold by
Ford Jessica L
Bought by
Ford Jeremy W
Purchase Details
Closed on
Dec 23, 2009
Sold by
Warner David W
Bought by
Ford Jeremy W and Ford Jessica L
Home Financials for this Owner
Home Financials are based on the most recent Mortgage that was taken out on this home.
Original Mortgage
$112,200
Interest Rate
4.88%
Mortgage Type
New Conventional
Purchase Details
Closed on
Mar 13, 2006
Sold by
Chase Manhattan Mortgage Corp
Bought by
Warner David W
Home Financials for this Owner
Home Financials are based on the most recent Mortgage that was taken out on this home.
Original Mortgage
$73,300
Interest Rate
6.25%
Mortgage Type
FHA
Create a Home Valuation Report for This Property
The Home Valuation Report is an in-depth analysis detailing your home's value as well as a comparison with similar homes in the area
Home Values in the Area
Average Home Value in this Area
Purchase History
We collect this data history from publicly available records. To have your information removed, we recommend requesting removal directly through your county’s website.
| Date | Buyer | Sale Price | Title Company |
|---|---|---|---|
| Bott Danielle | -- | None Listed On Document | |
| Milner Tarran T | -- | Mountain View Title | |
| Hulse Johnny | -- | Heritage Title Ins Ag Inc | |
| Jpmorgan Chase Bank Na | $69,190 | None Available | |
| Ford Jeremy W | -- | Box Elder Land Title Compan | |
| Ford Jeremy W | -- | -- | |
| Warner David W | -- | None Available |
Source: Public Records
Mortgage History
We collect this data history from publicly available records. To have your information removed, we recommend requesting removal directly through your county’s website.
| Date | Status | Borrower | Loan Amount |
|---|---|---|---|
| Open | Bott Danielle | $17,438 | |
| Open | Bott Danielle | $290,638 | |
| Previous Owner | Ford Jeremy W | $112,200 | |
| Previous Owner | Warner David W | $73,300 |
Source: Public Records
Tax History
| Year | Tax Paid | Tax Assessment Tax Assessment Total Assessment is a certain percentage of the fair market value that is determined by local assessors to be the total taxable value of land and additions on the property. | Land | Improvement |
|---|---|---|---|---|
| 2025 | $2,145 | $327,092 | $105,000 | $222,092 |
| 2024 | $1,866 | $320,325 | $100,000 | $220,325 |
| 2023 | $1,753 | $296,932 | $90,000 | $206,932 |
| 2022 | $1,673 | $146,163 | $13,750 | $132,413 |
| 2021 | $1,332 | $157,565 | $25,000 | $132,565 |
| 2020 | $1,133 | $157,565 | $25,000 | $132,565 |
| 2019 | $1,062 | $78,273 | $13,750 | $64,523 |
| 2018 | $793 | $54,599 | $13,750 | $40,849 |
| 2017 | $823 | $99,271 | $13,750 | $74,271 |
| 2016 | $780 | $52,654 | $13,750 | $38,904 |
| 2015 | $552 | $36,729 | $13,750 | $22,979 |
| 2014 | $552 | $35,635 | $13,750 | $21,885 |
| 2013 | -- | $35,635 | $13,338 | $22,297 |
Source: Public Records
Map
Nearby Homes
- 740 E Factory St
- 686 E Factory St Unit 166
- 662 E Factory St
- 786 E Factory St
- 675 E Factory St
- 665 E Factory St Unit 97
- 713 E Factory St
- 739 E Factory St
- 779 E Factory St
- 636 E Factory St
- 663 E Factory St
- 612 E Factory St
- 828 E Factory Garland Ut
- 802 E Factory St Unit 3
- 797 E Factory St
- 797 E Factory St
- 631 E Factory St
- 809 E Factory St
- 605 E Factory St
- 839 E Factory St
Your Personal Tour Guide
Ask me questions while you tour the home.