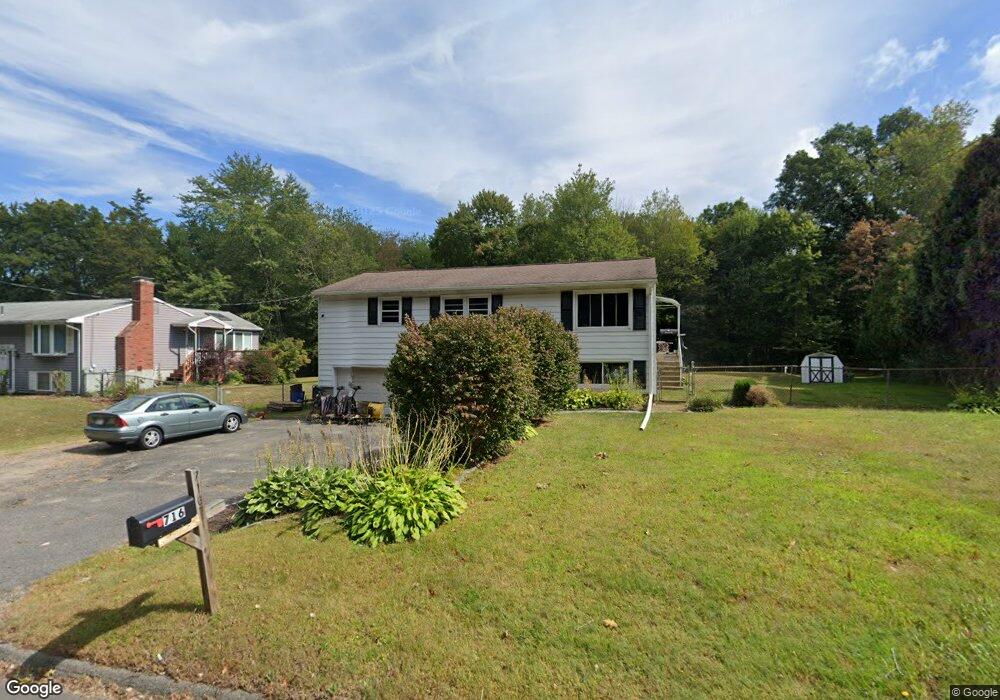
716 Fuller St Ludlow, MA 01056
Estimated Value: $309,000 - $412,000
3
Beds
1
Bath
1,464
Sq Ft
$240/Sq Ft
Est. Value
About This Home
This home is located at 716 Fuller St, Ludlow, MA 01056 and is currently estimated at $351,580, approximately $240 per square foot. 716 Fuller St is a home located in Hampden County with nearby schools including East Street Elementary School, Chapin Street Elementary School, and Paul R. Baird Middle School.
Ownership History
Date
Name
Owned For
Owner Type
Purchase Details
Closed on
Apr 26, 2022
Sold by
Siwicki Brian S
Bought by
Siwicki Brian S and Siwicki Keri A
Current Estimated Value
Home Financials for this Owner
Home Financials are based on the most recent Mortgage that was taken out on this home.
Original Mortgage
$200,000
Outstanding Balance
$175,832
Interest Rate
4.16%
Mortgage Type
New Conventional
Estimated Equity
$175,748
Purchase Details
Closed on
Mar 1, 2007
Sold by
Foisy Gertrude T
Bought by
Siwicki Brian S
Home Financials for this Owner
Home Financials are based on the most recent Mortgage that was taken out on this home.
Original Mortgage
$189,500
Interest Rate
6.27%
Mortgage Type
Purchase Money Mortgage
Create a Home Valuation Report for This Property
The Home Valuation Report is an in-depth analysis detailing your home's value as well as a comparison with similar homes in the area
Home Values in the Area
Average Home Value in this Area
Purchase History
| Date | Buyer | Sale Price | Title Company |
|---|---|---|---|
| Siwicki Brian S | -- | None Available | |
| Siwicki Brian S | -- | None Available | |
| Siwicki Brian S | -- | None Available | |
| Siwicki Brian S | $200,000 | -- | |
| Siwicki Brian S | $200,000 | -- |
Source: Public Records
Mortgage History
| Date | Status | Borrower | Loan Amount |
|---|---|---|---|
| Open | Siwicki Brian S | $200,000 | |
| Closed | Siwicki Brian S | $200,000 | |
| Previous Owner | Siwicki Brian S | $189,500 |
Source: Public Records
Tax History
| Year | Tax Paid | Tax Assessment Tax Assessment Total Assessment is a certain percentage of the fair market value that is determined by local assessors to be the total taxable value of land and additions on the property. | Land | Improvement |
|---|---|---|---|---|
| 2025 | $3,890 | $224,200 | $79,600 | $144,600 |
| 2024 | $3,846 | $212,600 | $79,500 | $133,100 |
| 2023 | $3,682 | $188,700 | $69,800 | $118,900 |
| 2022 | $3,554 | $177,800 | $69,800 | $108,000 |
| 2021 | $3,607 | $171,100 | $69,800 | $101,300 |
| 2020 | $3,491 | $169,300 | $68,700 | $100,600 |
| 2019 | $3,294 | $166,200 | $68,100 | $98,100 |
| 2018 | $3,116 | $163,900 | $68,100 | $95,800 |
| 2017 | $3,278 | $176,900 | $66,000 | $110,900 |
| 2016 | $3,149 | $173,700 | $61,100 | $112,600 |
| 2015 | $2,734 | $158,100 | $60,500 | $97,600 |
Source: Public Records
Map
Nearby Homes
- 339 Chicopee St Unit Lot 7
- 337 Chicopee St Unit Lot 8
- 173 Colonial Dr
- '0' Rood St
- 350 West St Unit 19
- 482 Holyoke St
- 80 R East St
- 382 Holyoke St
- 665 Center St Unit 705
- 665 Center St Unit 706
- 84 Chapin Greene Dr
- 70 Sroka Ln
- 42 East St
- 87 Morgan St
- 42 Loopley St
- 28 New Ludlow Rd
- 15 Hilltop Terrace
- 16 Sesame Dr
- Lot 2 Chicopee St
- 41 Morgan St