Estimated Value: $531,610 - $564,000
4
Beds
2
Baths
2,384
Sq Ft
$233/Sq Ft
Est. Value
About This Home
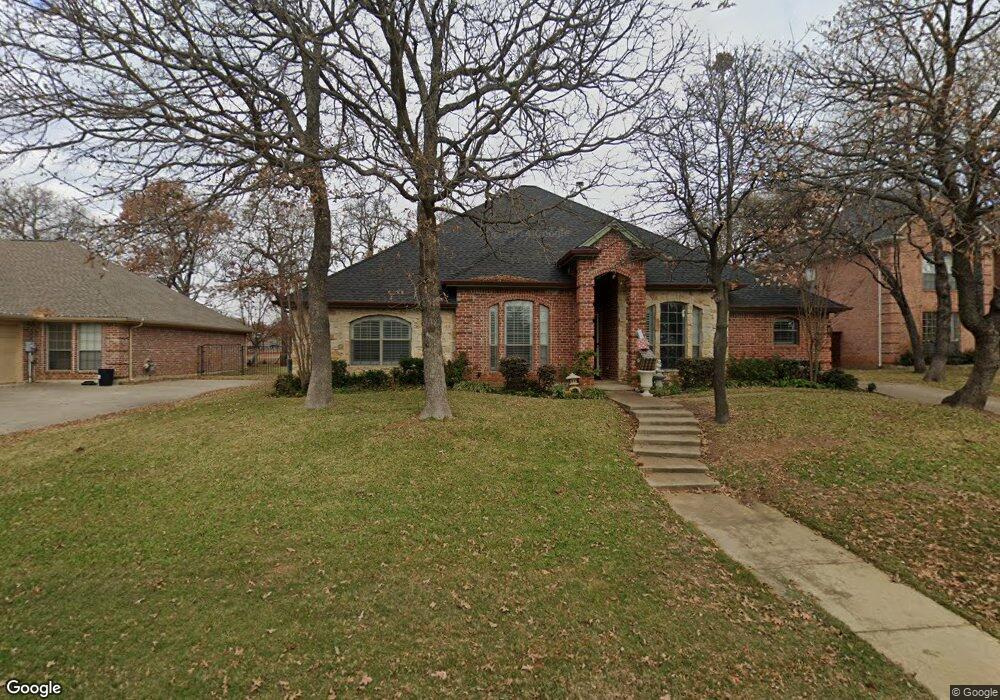
This home is located at 716 Lonesome Dove Trail, Hurst, TX 76054 and is currently estimated at $554,653, approximately $232 per square foot. 716 Lonesome Dove Trail is a home located in Tarrant County with nearby schools including W.A. Porter Elementary School, Smithfield Middle School, and Birdville High School.
Ownership History
Date
Name
Owned For
Owner Type
Purchase Details
Closed on
Nov 15, 2019
Sold by
Baker Rebecca S
Bought by
Troung Coung Huy
Current Estimated Value
Home Financials for this Owner
Home Financials are based on the most recent Mortgage that was taken out on this home.
Original Mortgage
$275,000
Outstanding Balance
$241,929
Interest Rate
3.6%
Mortgage Type
New Conventional
Estimated Equity
$312,724
Purchase Details
Closed on
Dec 14, 2012
Sold by
Lord Shauna Jeanine
Bought by
Baker Rebecca S
Home Financials for this Owner
Home Financials are based on the most recent Mortgage that was taken out on this home.
Original Mortgage
$182,500
Interest Rate
3.41%
Mortgage Type
Purchase Money Mortgage
Purchase Details
Closed on
May 17, 2001
Sold by
Texas Best Custom Homes Inc
Bought by
Snow Margaret Jean
Create a Home Valuation Report for This Property
The Home Valuation Report is an in-depth analysis detailing your home's value as well as a comparison with similar homes in the area
Home Values in the Area
Average Home Value in this Area
Purchase History
| Date | Buyer | Sale Price | Title Company |
|---|---|---|---|
| Troung Coung Huy | -- | Ttt | |
| Baker Rebecca S | -- | None Available | |
| Snow Margaret Jean | -- | Safeco Land Title |
Source: Public Records
Mortgage History
| Date | Status | Borrower | Loan Amount |
|---|---|---|---|
| Open | Troung Coung Huy | $275,000 | |
| Previous Owner | Baker Rebecca S | $182,500 |
Source: Public Records
Tax History Compared to Growth
Tax History
| Year | Tax Paid | Tax Assessment Tax Assessment Total Assessment is a certain percentage of the fair market value that is determined by local assessors to be the total taxable value of land and additions on the property. | Land | Improvement |
|---|---|---|---|---|
| 2025 | $8,862 | $450,000 | $85,850 | $364,150 |
| 2024 | $8,862 | $548,566 | $85,850 | $462,716 |
| 2023 | $10,056 | $494,212 | $85,850 | $408,362 |
| 2022 | $9,890 | $400,000 | $85,850 | $314,150 |
| 2021 | $9,789 | $383,462 | $70,000 | $313,462 |
| 2020 | $8,816 | $343,063 | $70,000 | $273,063 |
| 2019 | $9,362 | $361,508 | $70,000 | $291,508 |
| 2018 | $5,389 | $323,805 | $70,000 | $253,805 |
| 2017 | $8,023 | $307,533 | $70,000 | $237,533 |
| 2016 | $7,294 | $273,347 | $50,000 | $223,347 |
| 2015 | $5,375 | $261,126 | $50,000 | $211,126 |
| 2014 | $5,375 | $249,900 | $45,000 | $204,900 |
Source: Public Records
Map
Nearby Homes
- 3309 Texas Trail Ct
- 716 Bridget Way
- 712 Bear Creek Dr
- 716 Bear Creek Dr
- 713 Corsair Ct
- 621 Trails End Ct
- 3412 Glade Creek Dr
- 3512 Osprey Dr
- Bolsins Plan at Adkins Park
- Bellhaven Plan at Adkins Park
- 3404 Osprey Dr
- Grady Plan at Adkins Park
- 701 Corsair Ct
- Hillman Plan at Adkins Park
- Kenney Plan at Adkins Park
- Neece Plan at Adkins Park
- Bonham Plan at Adkins Park
- Todd Plan at Adkins Park
- 616A Plan at Adkins Park - 70'
- 655A Plan at Adkins Park - 70'
- 720 Lonesome Dove Trail
- 712 Lonesome Dove Trail
- 3412 Comanche Trail
- 724 Lonesome Dove Trail
- 708 Lonesome Dove Trail
- 709 Lonesome Dove Trail
- 705 Lonesome Dove Trail
- 3408 Comanche Trail
- 704 Lonesome Dove Trail
- 728 Lonesome Dove Trail
- 3404 Comanche Trail
- 3413 Texas Trail
- 3417 Texas Trail
- 3409 Texas Trail
- 3505 Texas Trail
- 3421 Texas Trail
- 3405 Texas Trail
- 3509 Texas Trail
- 732 Lonesome Dove Trail
- 3400 Comanche Trail