Estimated Value: $226,000 - $250,138
3
Beds
2
Baths
1,472
Sq Ft
$164/Sq Ft
Est. Value
About This Home
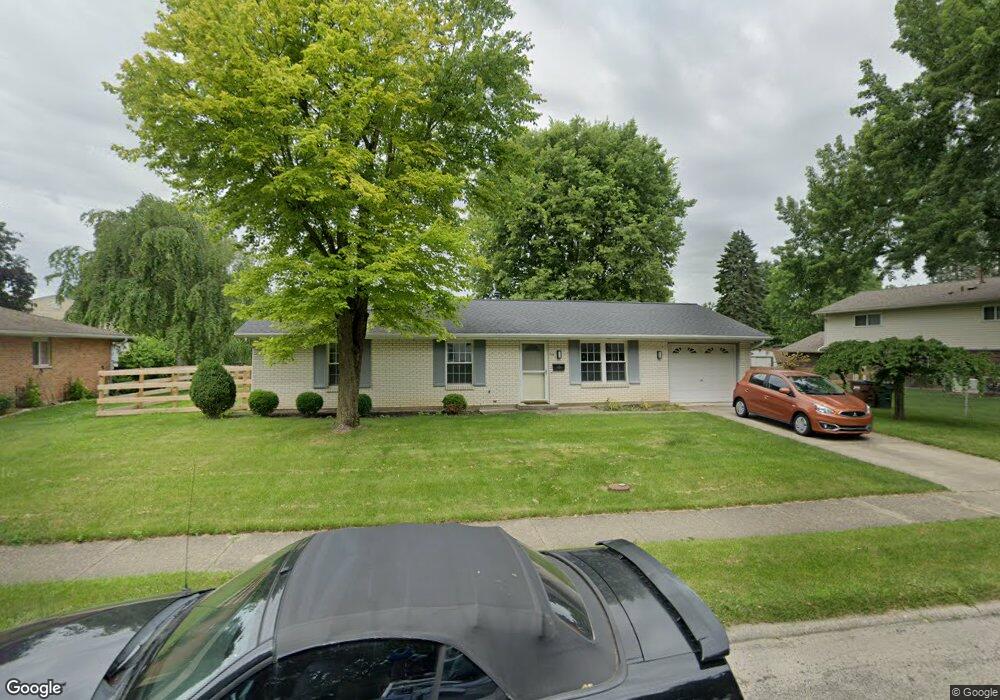
This home is located at 716 Marshall Dr, Xenia, OH 45385 and is currently estimated at $241,035, approximately $163 per square foot. 716 Marshall Dr is a home located in Greene County with nearby schools including Xenia High School and Legacy Christian Academy.
Ownership History
Date
Name
Owned For
Owner Type
Purchase Details
Closed on
Feb 4, 2022
Sold by
Moore Ryan S and Paige Audrey
Bought by
Whyde Justin and Whyde Traci
Current Estimated Value
Home Financials for this Owner
Home Financials are based on the most recent Mortgage that was taken out on this home.
Original Mortgage
$145,600
Outstanding Balance
$135,201
Interest Rate
3.55%
Mortgage Type
New Conventional
Estimated Equity
$105,834
Purchase Details
Closed on
Jun 30, 2021
Sold by
Ungard Carole S
Bought by
Zehring Ryan and Parker Randy
Purchase Details
Closed on
Jun 1, 2021
Sold by
Estate Of Michael T Ungard
Bought by
Ungard Carole J
Create a Home Valuation Report for This Property
The Home Valuation Report is an in-depth analysis detailing your home's value as well as a comparison with similar homes in the area
Home Values in the Area
Average Home Value in this Area
Purchase History
| Date | Buyer | Sale Price | Title Company |
|---|---|---|---|
| Whyde Justin | -- | Lucas Joseph C | |
| Zehring Ryan | $64,000 | None Available | |
| Ungard Carole J | -- | None Available |
Source: Public Records
Mortgage History
| Date | Status | Borrower | Loan Amount |
|---|---|---|---|
| Open | Whyde Justin | $145,600 |
Source: Public Records
Tax History Compared to Growth
Tax History
| Year | Tax Paid | Tax Assessment Tax Assessment Total Assessment is a certain percentage of the fair market value that is determined by local assessors to be the total taxable value of land and additions on the property. | Land | Improvement |
|---|---|---|---|---|
| 2024 | $2,777 | $64,900 | $10,430 | $54,470 |
| 2023 | $2,777 | $64,900 | $10,430 | $54,470 |
| 2022 | $2,389 | $47,620 | $6,520 | $41,100 |
| 2021 | $1,617 | $41,370 | $6,520 | $34,850 |
| 2020 | $1,547 | $41,370 | $6,520 | $34,850 |
| 2019 | $1,429 | $37,110 | $7,660 | $29,450 |
| 2018 | $1,435 | $37,110 | $7,660 | $29,450 |
| 2017 | $1,292 | $37,110 | $7,660 | $29,450 |
| 2016 | $1,293 | $33,840 | $7,660 | $26,180 |
| 2015 | $1,296 | $33,840 | $7,660 | $26,180 |
| 2014 | $1,240 | $33,840 | $7,660 | $26,180 |
Source: Public Records
Map
Nearby Homes
- 610 Saxony Dr
- 513 Redbud Ln
- 656 Eden Roc Dr
- 508 Marshall Dr
- 568 Louise Dr
- 479 N Stadium Dr
- 348 S Stadium Dr
- 1311 Eagles Way
- 1038 Frederick Dr
- 878 N Detroit St
- 902 N Detroit St
- 1359 Eagles Way
- 659 N King St
- 119 Park Dr
- 645 E Church St
- 1171 N Detroit St
- 612 E Market St
- 516 N King St
- 0 N Patton St
- 00 N Patton St