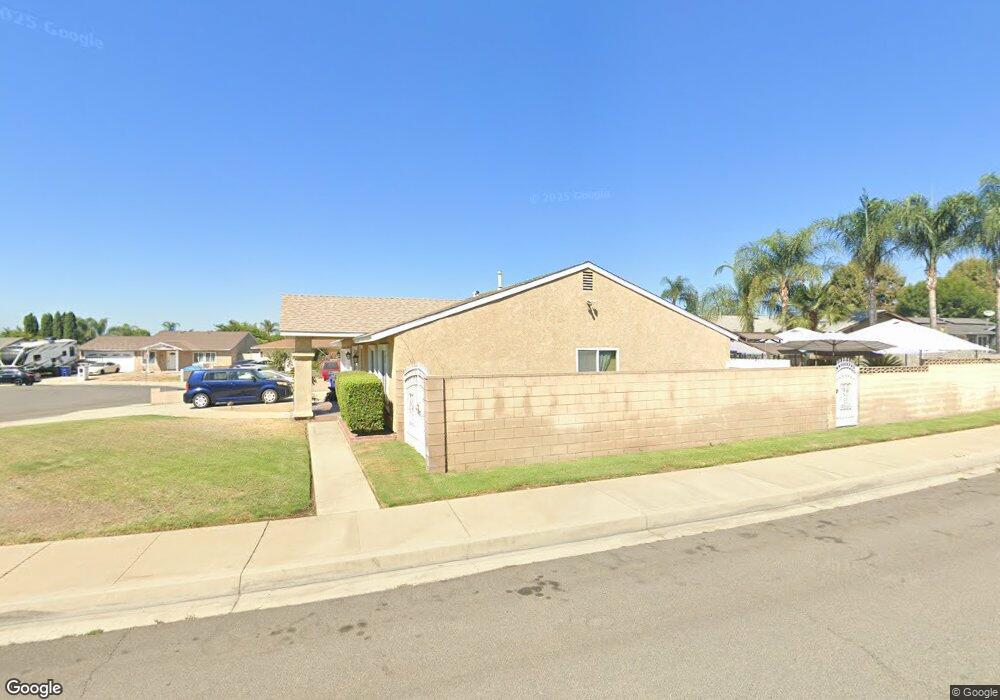
716 Misty Ct Ontario, CA 91762
Downtown Ontario NeighborhoodEstimated Value: $670,000 - $721,000
About This Home
This home is located at 716 Misty Ct, Ontario, CA 91762 and is currently estimated at $696,195, approximately $586 per square foot. 716 Misty Ct is a home located in San Bernardino County with nearby schools including Richard Haynes Elementary, Oaks Middle, and Ontario High School.
Ownership History
We collect this data history from publicly available records. To have your information removed, we recommend requesting removal directly through your county’s website.
Purchase Details
Home Financials for this Owner
Home Financials are based on the most recent Mortgage that was taken out on this home.Purchase Details
Home Financials for this Owner
Home Financials are based on the most recent Mortgage that was taken out on this home.Purchase Details
Home Financials for this Owner
Home Financials are based on the most recent Mortgage that was taken out on this home.Purchase Details
Purchase Details
Home Financials for this Owner
Home Financials are based on the most recent Mortgage that was taken out on this home.Purchase Details
Purchase Details
Home Financials for this Owner
Home Financials are based on the most recent Mortgage that was taken out on this home.Purchase Details
Home Financials for this Owner
Home Financials are based on the most recent Mortgage that was taken out on this home.Purchase Details
Home Financials for this Owner
Home Financials are based on the most recent Mortgage that was taken out on this home.Purchase Details
Home Financials for this Owner
Home Financials are based on the most recent Mortgage that was taken out on this home.Purchase Details
Home Financials for this Owner
Home Financials are based on the most recent Mortgage that was taken out on this home.Purchase Details
Purchase Details
Home Financials for this Owner
Home Financials are based on the most recent Mortgage that was taken out on this home.Home Values in the Area
Average Home Value in this Area
Purchase History
We collect this data history from publicly available records. To have your information removed, we recommend requesting removal directly through your county’s website.
| Date | Buyer | Sale Price | Title Company |
|---|---|---|---|
| -- | Pacific Coast Title Company | ||
| -- | California Title Company | ||
| $247,000 | California Title Company | ||
| $270,000 | Accommodation | ||
| -- | Financial Title Company | ||
| -- | New Century Title Company | ||
| $227,000 | Orange Coast Title | ||
| -- | Orange Coast Title | ||
| -- | Orange Coast Title | ||
| $140,000 | Gateway Title Company | ||
| -- | Gateway Title Company | ||
| $87,500 | Gateway Title Company | ||
| $134,035 | United Title Company | ||
| $125,000 | American Title |
Mortgage History
We collect this data history from publicly available records. To have your information removed, we recommend requesting removal directly through your county’s website.
| Date | Status | Borrower | Loan Amount |
|---|---|---|---|
| Open | $235,200 | ||
| Closed | $243,782 | ||
| Previous Owner | $391,000 | ||
| Previous Owner | $227,000 | ||
| Previous Owner | $138,753 | ||
| Previous Owner | $101,000 | ||
| Previous Owner | $124,029 |
Tax History
We collect this data history from publicly available records. To have your information removed, we recommend requesting removal directly through your county’s website.
| Year | Tax Paid | Tax Assessment Tax Assessment Total Assessment is a certain percentage of the fair market value that is determined by local assessors to be the total taxable value of land and additions on the property. | Land | Improvement |
|---|---|---|---|---|
| 2025 | $3,429 | $318,081 | $109,462 | $208,619 |
| 2024 | $3,350 | $311,844 | $107,316 | $204,528 |
| 2023 | $3,254 | $305,730 | $105,212 | $200,518 |
| 2022 | $3,210 | $299,735 | $103,149 | $196,586 |
| 2021 | $3,188 | $293,857 | $101,126 | $192,731 |
| 2020 | $3,132 | $290,844 | $100,089 | $190,755 |
| 2019 | $3,103 | $285,141 | $98,126 | $187,015 |
| 2018 | $3,059 | $279,550 | $96,202 | $183,348 |
| 2017 | $2,948 | $274,069 | $94,316 | $179,753 |
| 2016 | $2,830 | $268,695 | $92,467 | $176,228 |
| 2015 | $2,810 | $264,659 | $91,078 | $173,581 |
| 2014 | $2,736 | $259,475 | $89,294 | $170,181 |
Map
- 732 W Phillips St Unit 18
- 1216 S Cypress Ave Unit E
- 1218 S Cypress Ave Unit B
- 1112 S Cypress Ave
- 0 W Phillips St
- 1230 S Cypress Ave
- 1031 S Palmetto Ave Unit S-8
- 1031 S Palmetto Ave Unit J9
- 1330 S Fern Ave
- 322 W Phillips St
- 923 S Vine Ave
- 920 S Palmetto Ave Unit 9
- 427 W Maple St
- 905 S Mountain Ave
- 1420 S Euclid Ave
- 861 S Mountain Ave
- 850 W Mission Blvd Unit A46
- 850 W Mission Blvd Unit B21
- 849 S Mountain Ave
- 1831 Holly Ave
Ask me questions while you tour the home.