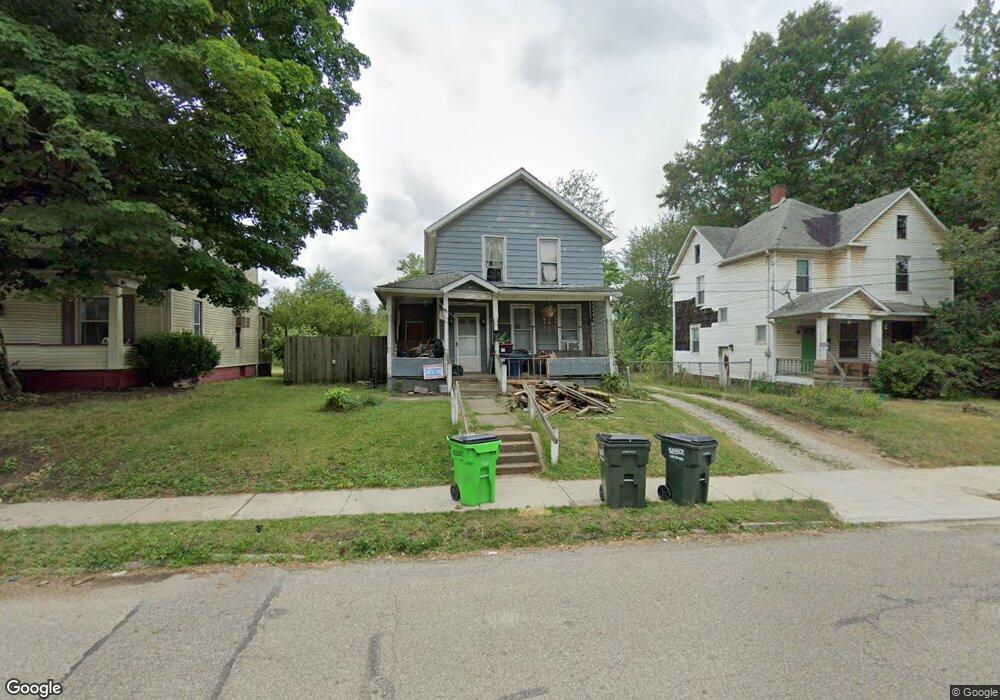
716 N Webb Ave Alliance, OH 44601
Estimated Value: $44,172 - $117,000
2
Beds
2
Baths
1,479
Sq Ft
$52/Sq Ft
Est. Value
About This Home
This home is located at 716 N Webb Ave, Alliance, OH 44601 and is currently estimated at $77,543, approximately $52 per square foot. 716 N Webb Ave is a home located in Stark County with nearby schools including Alliance Early Learning School, Alliance Intermediate School at Northside, and Alliance Middle School.
Ownership History
Date
Name
Owned For
Owner Type
Purchase Details
Closed on
Nov 22, 2018
Sold by
Sloat Brendon J
Bought by
Mcmasters Daniel
Current Estimated Value
Purchase Details
Closed on
Jul 22, 2016
Bought by
Joseph Mcmasters and Sarah Mcmasters
Home Financials for this Owner
Home Financials are based on the most recent Mortgage that was taken out on this home.
Interest Rate
3.45%
Purchase Details
Closed on
Mar 13, 2010
Sold by
Nitz Robert E and Nitz Melinda K
Bought by
Mcmasters John and Mcmasters Marie
Purchase Details
Closed on
Aug 4, 2005
Sold by
Dunn Julius
Bought by
Nitz Robert E and Nitz Melinda K
Home Financials for this Owner
Home Financials are based on the most recent Mortgage that was taken out on this home.
Original Mortgage
$5,351
Interest Rate
5.71%
Mortgage Type
Purchase Money Mortgage
Create a Home Valuation Report for This Property
The Home Valuation Report is an in-depth analysis detailing your home's value as well as a comparison with similar homes in the area
Home Values in the Area
Average Home Value in this Area
Purchase History
| Date | Buyer | Sale Price | Title Company |
|---|---|---|---|
| Mcmasters Daniel | $9,300 | None Available | |
| Joseph Mcmasters | $9,700 | -- | |
| Mcmasters John | $12,000 | None Available | |
| Nitz Robert E | $5,000 | -- |
Source: Public Records
Mortgage History
| Date | Status | Borrower | Loan Amount |
|---|---|---|---|
| Previous Owner | Joseph Mcmasters | -- | |
| Previous Owner | Nitz Robert E | $5,351 |
Source: Public Records
Tax History
| Year | Tax Paid | Tax Assessment Tax Assessment Total Assessment is a certain percentage of the fair market value that is determined by local assessors to be the total taxable value of land and additions on the property. | Land | Improvement |
|---|---|---|---|---|
| 2025 | $2,490 | $8,790 | $3,890 | $4,900 |
| 2024 | $2,016 | $8,790 | $3,890 | $4,900 |
| 2023 | $1,964 | $5,430 | $770 | $4,660 |
| 2022 | $220 | $5,430 | $770 | $4,660 |
| 2021 | $220 | $5,430 | $770 | $4,660 |
| 2020 | $169 | $3,890 | $560 | $3,330 |
| 2019 | $166 | $3,890 | $560 | $3,330 |
| 2018 | $167 | $3,890 | $560 | $3,330 |
| 2017 | $323 | $3,400 | $460 | $2,940 |
| 2016 | $150 | $3,400 | $460 | $2,940 |
| 2015 | $151 | $3,400 | $460 | $2,940 |
| 2014 | $146 | $3,130 | $740 | $2,390 |
| 2013 | $73 | $3,130 | $740 | $2,390 |
Source: Public Records
Map
Nearby Homes
- 1025 Reed St
- 16190 River St NE
- 847 E Patterson St
- 1226 Noble St
- 15832 Waverly St NE
- 710 N Freedom Ave
- 11344 Walnut Ave NE
- 361 E Main St
- 505 N Union Ave
- V/L S Freedom Ave
- 62 E Market St
- 000 Lexington Rd
- 442 S Liberty Ave
- 717 Garfield Ave
- 62 E High St
- 171 1/2 W Main St
- 163 W Market St
- 427 S Union Ave
- 452 E Summit St
- 0 E Oxford St
Your Personal Tour Guide
Ask me questions while you tour the home.