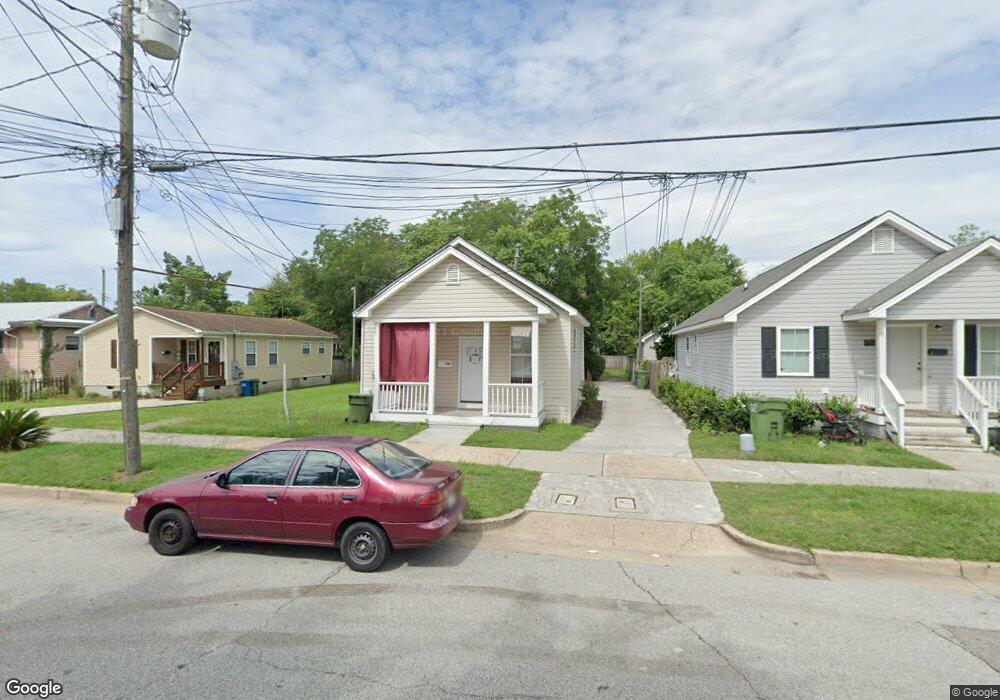
716 S 8th St Wilmington, NC 28401
Dry Pond-South Side NeighborhoodEstimated Value: $257,000 - $517,000
2
Beds
1
Bath
740
Sq Ft
$469/Sq Ft
Est. Value
About This Home
This home is located at 716 S 8th St, Wilmington, NC 28401 and is currently estimated at $347,413, approximately $469 per square foot. 716 S 8th St is a home located in New Hanover County with nearby schools including Snipes Academy of Arts & Design, Williston Middle School, and John T. Hoggard High School.
Ownership History
Date
Name
Owned For
Owner Type
Purchase Details
Closed on
May 2, 2006
Sold by
South Metro Properties Llc
Bought by
Smi 93 Llc
Current Estimated Value
Home Financials for this Owner
Home Financials are based on the most recent Mortgage that was taken out on this home.
Original Mortgage
$382,500
Outstanding Balance
$21,901
Interest Rate
6.28%
Mortgage Type
Purchase Money Mortgage
Estimated Equity
$325,512
Purchase Details
Closed on
Jan 9, 1997
Sold by
Maynard Russell M
Bought by
South Metro Properties Llc
Purchase Details
Closed on
Sep 28, 1995
Sold by
Maynard Russell M
Bought by
Eloise Nichols
Purchase Details
Closed on
Sep 25, 1995
Sold by
Nichols Eloise
Bought by
Maynard Russell M
Purchase Details
Closed on
Aug 2, 1995
Sold by
Nichols Eloise
Bought by
Maynard Russell M
Purchase Details
Closed on
Jul 1, 1981
Bought by
Nichols Lorenzo
Create a Home Valuation Report for This Property
The Home Valuation Report is an in-depth analysis detailing your home's value as well as a comparison with similar homes in the area
Home Values in the Area
Average Home Value in this Area
Purchase History
| Date | Buyer | Sale Price | Title Company |
|---|---|---|---|
| Smi 93 Llc | $450,000 | None Available | |
| South Metro Properties Llc | -- | -- | |
| Eloise Nichols | -- | -- | |
| Maynard Russell M | -- | -- | |
| Maynard Russell M | $10,000 | -- | |
| Nichols Lorenzo | -- | -- |
Source: Public Records
Mortgage History
| Date | Status | Borrower | Loan Amount |
|---|---|---|---|
| Open | Smi 93 Llc | $382,500 |
Source: Public Records
Tax History Compared to Growth
Tax History
| Year | Tax Paid | Tax Assessment Tax Assessment Total Assessment is a certain percentage of the fair market value that is determined by local assessors to be the total taxable value of land and additions on the property. | Land | Improvement |
|---|---|---|---|---|
| 2025 | $1,615 | $301,400 | $71,100 | $230,300 |
| 2024 | $1,615 | $185,600 | $50,200 | $135,400 |
| 2023 | $1,615 | $185,600 | $50,200 | $135,400 |
| 2022 | $1,578 | $185,600 | $50,200 | $135,400 |
| 2021 | $1,588 | $185,600 | $50,200 | $135,400 |
| 2020 | $828 | $78,600 | $12,700 | $65,900 |
| 2019 | $828 | $78,600 | $12,700 | $65,900 |
| 2018 | $828 | $78,600 | $12,700 | $65,900 |
| 2017 | $828 | $78,600 | $12,700 | $65,900 |
| 2016 | $544 | $49,100 | $19,500 | $29,600 |
| 2015 | $520 | $49,100 | $19,500 | $29,600 |
| 2014 | $498 | $49,100 | $19,500 | $29,600 |
Source: Public Records
Map
Nearby Homes